Preparative
Published over 9 years ago. See the latest and most current information on Preparative.
Two applications of combined supercritical fluid extraction – supercritical fluid preparative chromatography (extraction-injection or ‘X-Injection’) are illustrated. One is the concentration and isolation of impurities in a sample wherein the impurities are selectively extracted from a mixture and are eluted within the first few injections, thus dramatically reducing the time required for their isolation for subsequent characterisation. The other, the direct isolation of natural products from an organic matrix, arose from this study. Although an extremely rapid and complete isolation of minor components was not feasible due to the kinetics of extraction, this process can be used for the rapid isolation of components of natural materials without separate extraction and separation steps.
A recent paper described the application of extraction-injection in preparative SFC [1]. The advantages of the technique were predominantly due to the dissolution of the samples in the supercritical fluid rather than in the polar component of the mobile phase, as is done conventionally. In such conventional injection, whether made into the mixed solvent stream or into the co-solvent stream alone, there is the likelihood of sample precipitation from solution as the solution in its strong solvent is mixed with the less polar, weaker CO2 – co-solvent mixture. Such precipitation results either in a momentary pressure increase during the injection process or can result in blocked columns or filters as the sample or some components are deposited. Dissolution in the supercritical mobile phase prevents this deposition. This was achieved by loading the sample coated on a suitable, preferably non-adsorptive, support into an extractor which is used in place of an injection loop. Pressurisation of the extractor with the mobile phase allows dissolution of the sample which is then periodically injected into the column by opening the injection valve for a defined injection time. Additional benefits of the technique were found to be improved peak shapes and the ability to inject large volumes while avoiding the peak distortions and inconvenience frequently experienced with large injection loops.
During the course of this work some anomalies were noted in the chromatograms arising from the first injection in a sequence. The work reported here is the result of investigating these anomalies and the extension of the findings into the field of natural product isolation.
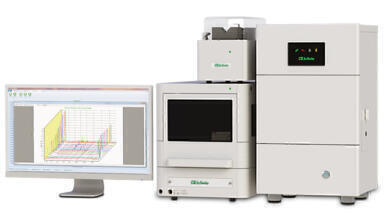
SFC equipment: SFC-PICLab Hybrid 10-100 analytical/preparative SFC system (PIC Solution Inc, Media, PA).
Preparative Column: CHIRALCEL OD-H, 150 x 21.2 mm (Chiral Technologies, Inc, West Chester, PA}.
Mobile phase (warfarin analysis): 15% or 20% methanol in CO2 at a flow rate of 60 ml/min; back pressure 100 bar, oven temperature 40°C.
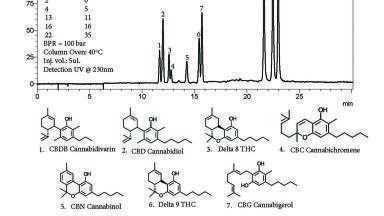
Mobile phase (Cloves analysis): extraction at 0% methanol for 20 seconds, followed by a gradient from 5% to 40% methanol in 7 minutes. Flow rate 60 ml/min, back pressure 100 and 150 bar, oven temperature 40°C. Detection at 230 nm.
Analytical Columns: CHIRALCEL OD-H, CHIRALPAK AD-H (Chiral Technologies, West Chester, PA), GreenSep Basic (ES Industries, E Berlin, NJ) and DAISOGEL SP-100 silica (Daiso Fine Chem USA, Inc., Torrance, CA), all 150 x 4.6 mm
Warfarin was purchased from Sigma-Aldrich. Cloves were purchased locally.
DAISOGEL 50 micron C-1 phase was kindly donated by Daiso Fine Chem USA.
Empty Column blanks (AmChemTeq, Port Matilda, PA, 100 x 10 mm and 50 x 21.2 mm) were used as extractors, being dry-packed with material coated on 50 µm C-1 silica or with finely ground cloves.
HPLC Equipment: Agilent 1200 LC with LC/MSD SL
Column: Gemini-NX C18, 3 micron; 30 x 4.6 mm
Mobile Phase: 30% Acetonitrile in 50:50 (v:v) water : methanol containing 0.1% formic acid; flow rate 2 ml/min
Temperature: Ambient. Injection Volume: 10 µl UV detection 220 nm.
Previous work on extraction-injection for preparative separations was carried out by coating a sample on a suitable stationary phase and loading this into an extraction cartridge which replaced the injection loop in the standard injector on the Hybrid system. The design of the injector allows pressurisation of the extractor with the supercritical mobile phase during the separation process and making sequential injections by a time-based opening of the injection valve to introduce a certain volume of the extractor content into the column. An initial experiment designed to develop suitable separation conditions for the preparative separation of Warfarin enantiomers was run. A sample of warfarin (750 mg) was coated on the C-1 support (4.2g) using acetone as solvent and evaporating to dryness in a rotary evaporator. The resulting free-flowing material was packed into a column 100 x 10 mm used as an extraction cartridge. The small void at the top of the cartridge was filled with fresh C-1 material. The chromatogram from the first injection of 10 seconds (approximately 10 ml) is shown in Figure 1. Multiple impurity peaks were observed. Further injections from the extractor were made after increasing the methanol content of the mobile phase from 15 to 20% to reduce the separation time. Figure 2 shows the 2nd and 3rd injections, of 20 and 30 seconds respectively. The difference between the first and second injections is remarkable and other experiments were run to ensure that the large number of peaks in the first injection did not arise from an external source such as the DAISOGEL 50 micron C-1 support. A sample of the support loaded into a fresh extractor did not result in eluted peaks. Further, a 600 mg sample of Warfarin was loaded directly (i.e. without coating on a support) into a 50 x 10 mm extractor and a similar series of injections (i.e. 10, 20 and 30 second loadings) were run. Again, the initial injection contained multiple peaks while all subsequent injections contained just the two enantiomers.
The explanation of this at first surprising phenomenon is relatively straightforward. Warfarin is not especially soluble in the supercritical fluid – it was estimated that the solubility in the 20% methanol in CO2 in these experiments is approximately 1.33 g/l. Thus, only a small part of the material was dissolved in the extraction cartridge. In the 10 second initial injection, roughly 13 mg of warfarin were injected from the saturated solution in the extractor. In contrast, the impurity level in the sample was low and the impurities would not be expected to reach saturation in the extractor, so it would thus be expected that most of each would dissolve in the approximately 5.7 ml of mobile phase contained in the extractor. Passage of the mobile phase through the extractor would therefore elute the impurities along with the warfarin enantiomers. As the support was chosen to be unlikely to retain the products, passage of a little under 2 extractor volumes of solvent should suffice to elute all the impurities. This represents a significant concentration of the impurities – roughly 57-fold, given that only 1.7% of the warfarin was eluted (13 mg from 750).
The chromatogram may be compared with the conventional injection of 12 mg of the same sample of warfarin in Figure 3.
An additional set of extraction experiments was run using a second warfarin sample, loaded at 800 mg on 4.1 g of C-1 support. A series of injections each of 11 seconds duration (equal to two extractor volumes) was run and the area of each impurity peak was measured. Figure 4 shows a plot of peak area at 250 nm versus injection number, indicating that most of the impurities were removed after the first injection with only a few low-concentration remnants remaining in the second.
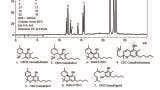
The experiment was repeated, this time while collecting the various peaks eluted from the mixture. A minor adaptation to the standard PIC Solution cyclone collector enabled manual collection in 20 ml scintillation vials. Figure 5 shows the peaks collected. The 21 resulting fractions were analysed by reversed phase HPLC-MS; the resulting chromatograms are shown in Figure 6. Not all UV-active peaks gave useful mass spectra but where acceptable data were obtained the molecular weight(s) associated with the peaks are shown. As the goal of this experiment was not to identify all warfarin impurities but to illustrate that the extraction experiment can be used for the rapid concentration and isolation of impurities, no further attempts were made to analyse the mass spectra or to purify the fractions further. Peaks labelled ‘W’ are warfarin. Fractions 7, 8 and 11 and 12 are not shown; these contain the warfarin enantiomers. Fraction 2 contained no detectable peaks while fraction 3 was assigned the identity of acetone, the coating solvent. The reversed phase separation is largely orthogonal to the SFC separation and illustrates the utility of such two-dimensional analysis; some of the components collected are largely pure, while many of them show multiple peaks in HPLC despite being eluted as a single peak under the SFC conditions. The apparently identical (in terms of retention time and mass) major peaks in fractions 16 and 17 suggest that these two peaks are made up of at least two enantiomeric pairs, while fractions 21 and 22 are probably reasonably pure enantiomers. Table 1 summarises the results.
The separation was continued until the sample was exhausted, collecting the two enantiomers. The total recovery of warfarin from the experiment was 92%.
Following the results of the warfarin experiments, it became of interest to find if a similar phenomenon would be found in the extraction of natural products from their organic matrix. Previously studies on the supercritical CO2 extraction of cloves has been carried out, with the result that the extract contained mainly eugenol and eugenyl acetate under conditions not far from those that could be used in SFC [2]. In addition, 21 other components of clove oil extracted by various procedures including SFE have been reported [3]. A study by Prado [4] indicated that the overall extraction curve for the extraction of clove oil from clove buds with supercritical CO2 follows the usual form of constant extraction rate, falling extraction rate and diffusion controlled periods [5]. However, for the combined SFE/SFC experiment it was of interest to observe if the minor components would be extracted more effectively than the major ones. At the same time it was also an objective to evaluate the effectiveness of a combined extraction-injection separation of the clove components as a model for the purification and isolation of more valuable components from natural product mixtures.
Initial experiments to find a suitable column for the separation were carried out isocratically using four columns and commercial clove oil as sample. Two of these were enantioselective polysaccharide-based phases, not because the products from the cloves were expected to be chiral but because such columns have been observed to give excellent selectivity for other achiral natural products. The commercial product contained essentially two ingredients which were assigned to be eugenyl acetate and eugenol on the basis of the known composition of such oils [2]. In the event, an enantioselective phase (CHIRALPAK OD-H) was chosen for the preparative work on the basis of selectivity, retention and peak shape. Based on peak area at 230 nm, the clove oil was assigned a eugenol purity of 92%.
In order to extract the volatile oils while leaving less volatile, more polar components behind in the matrix, it was decided to run the extraction using pure CO2. This strategy maintained pure CO2 in the extractor rather than the co-solvent – CO2 mixture used for the chromatographic separation. Extraction using a percentage of co-solvent would be expected to increase the extraction of polar components. The extractions were carried out at room temperature (i.e. 22 -23°C).
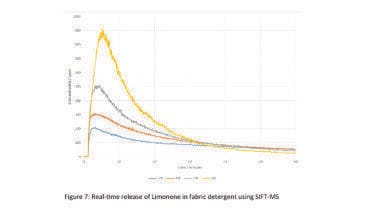
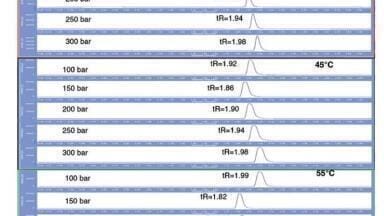
A sample of cloves was ground in a conventional kitchen blender and loaded into an extractor 100 x 10 mm. Using an injection time of 2 seconds (i.e. approximately 2 ml volume) under isocratic conditions at 5% methanol gave the chromatogram shown in Figure 7. In order to ensure elution of the more polar components, an elution gradient was developed. The extraction was carried out at two different pressures, modulated by the pressure at the back pressure regulator (100 and 150 bar) and the column pressure drop of 26 bar. The two chromatograms in Figure 8 show the differences in the results. Additional material was extracted at the higher pressure as would be expected. While integration of the overloaded and overlapped peaks is not accurate, it is possible to estimate the increase in quantity extracted from several of the minor components that are a little better resolved than the others. On this basis, one can estimate a 1.85-fold increase in extracted material resulting from the 50 bar increase in pressure. At the same time, the increase in operating pressure also changed the selectivity of the separation with a decrease in retention and some loss in resolution between several of the components.
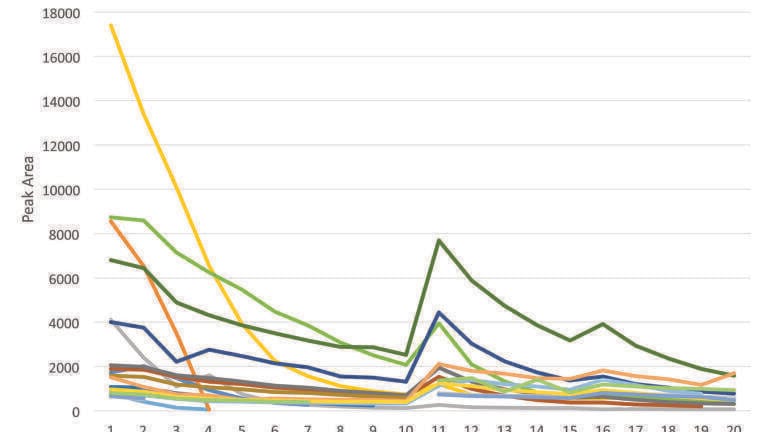
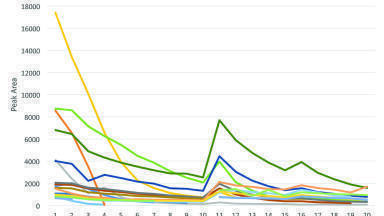
A production experiment, making multiple injections to follow the trajectory of minor component concentrations was carried out under the same conditions with a 2 second injection period and 100 bar back pressure. In contrast to the experiment with warfarin, the injection volume here was less than the extractor volume of around 6 ml. Since in the case of warfarin the minor components were eluted in the first two injections, it would be expected that between three and six injections would be necessary here to achieve the same result. The chromatogram (at 250 nm) of the first ten injections is shown in Figure 9. While some early eluting components diminished in concentration over the first 4 or 5 injections, concentrations of many of the later eluting components were reduced by a much smaller factor. A plot of minor component peak areas (at 230 nm) against injection number is shown in Figure 10. This includes data taken for the first 10 injections at 2 seconds, followed by 5 injections at 10 seconds and a further 5 at 20 seconds duration. The early eluting components diminished in concentration within the first 4 to 8 injections whereas the more retained (and presumably more polar) constituents maintained an appreciable concentration in the extracts even after 20 injections. This presumably follows the solubility of these components in pure CO2 and perhaps a low diffusion rate of these components from the matrix. This is in contrast to the rapid elution of the warfarin components, perhaps because these were coated in an approximately monomolecular layer on the surface of the support (calculated from the relative surface areas of the support and the warfarin molecule and its concentration) rather than located within a complex organic matrix.
While the peak areas of the major component (eugenol) are difficult to measure due to the high mass overload, it is clear that this component, despite a good solubility in the supercritical CO2, is not rapidly extracted but appears to follow the normal Overall Extraction Curve format for extraction with a rapid initial extraction rate falling to a diffusion-controlled process as the extraction continues. It is possible that the rather large particle size of the ground cloves contributed to the slow reduction in concentrations of the less-soluble components and further experiments using smaller particle sizes and extraction solvents containing a polar co-solvent to enhance the solubility are planned.
The products from this experiment and another using 10.7 g of ground cloves in an extractor 50 x 21.2 mm were collected. Analysis of one of the products is shown in Figure 11. No impurities could be detected in the product fractions from these and from an experiment using conventional injection of 68 mg of commercial clove oil under the same separation conditions. The recovery of eugenol from the clove oil was calculated to be 92%; the content of eugenol in the cloves used in the two extraction experiments was calculated to be 7.22% and 7.75% respectively for the two extractions.
The results of the work described in this paper show that extraction-injection techniques in preparative SFC can allow a very rapid isolation and purification of impurities in a sample by selectively extracting them into a purification column. Rather than spending a long time in injecting a solution of the product when the concentrations of the impurities in the injected material remain that in the original sample, the present method allows the concentration of the impurities and their elution within the first few injections. The higher concentrations also make it easier to detect and isolate minor components. Application of the technique to a natural product complicated the simple procedure by the kinetics of extraction from the organic matrix. Although some components were rapidly extracted and eluted, other, more polar, compounds followed a much slower extraction regime which was probably controlled by lower solubility in the supercritical CO2 and diffusion from the matrix. The major component of the cloves was isolated in good recovery and at very high purity. Thus, the method is clearly applicable to the rapid isolation of components of natural products by combining the extraction and separation into a single process. It is arguable if it is more efficient to extract all the material first, followed by separation or to use the extraction-injection technique. While further experiments are planned to elucidate this, it is quite probable that the best procedure will turn out to be application-dependent.
I wish to thank Neal Byrne of Lotus Separations LLC (Princeton, NJ) for running the LC-MS analyses.
[1]. M Shaimi and G B Cox, Chromatography Today, November/December 2014, 7, 42.
[2] Farshad Yazdani, Morteza Mafi, Fathollah Farhadi, Kourosh Tabar-Heidar, Kioumars Aghapoor, Farshid Mohsenzadeh, and Hossein Reza Darabi Z. Naturforsch. 60b, (2005), 1197.
[3] Guan Wenqiang, Li Shufen, Yan Ruixiang, Tang Shaokun, Quan Can, Food Chemistry 101 (2007) 1558–1564
[4] Juliana M. Prado, Glaucia H.C. Prado, M. Angela A. Meireles, J. of Supercrit. Fluids, 56, (2011), 231.
[5] Helena Sovová, Chemical Engineering Science, 49, (1994), 409.


-(1).jpg)