Preparative
Published over 9 years ago. See the latest and most current information on Preparative.
A simple, selective and precise reversed-phase high-performance liquid chromatography (RP-HPLC) method for the simultaneous quantification of 16 and validation of 11 related substances of salmeterol xinafoate and fluticasone propionate in an inhalation powder has been developed using a 15 cm x 4.6 mm, 5 µm octylsilane silica gel column (Hypersil C8 BDS, Thermo Fisher Scientific, Runcorn, UK). The chromatographic separation employs a gradient elution using a mobile phase consisting of a buffer containing 0.1M ammonium dihydrogen phosphate (pH2.9) and acetonitrile at a flow rate of 2.0 mL min−1 through the column. The samples are detected using UV at 228 nm. The column temperature is thermostatically controlled at 30ºC, with the samples stored in the autosampler compartment at 15ºC. The validated method could separate all known related impurities from salmeterol and fluticasone propionate peaks and the peak purities were confirmed by photo-diode array detector.
Salmeterol xinafoate (SX) is grouped in a class of medications called β2 adrenergic receptors agonists, while fluticasone propionate (FP) is grouped in the corticosteroid class of medications. The combination of SX and FP works by reversing the bronchoconstriction occurring in asthma [1]. SX dissociates in solution to yield the salmeterol base and the hydroxynaphthoate (xinafoic acid), and displays poor aqueous solubility (lower than 62 µg mL−1 for the micronised material) [2]. Salmeterol is a weak base (a secondary amine) with an ionisable phenol. Its two pKa values have been estimated as 8.3 and 10.3, respectively [3], ensuring that the molecule is >99.9% positively charged below neutral pH. Xinafoic acid has a pKa of approximately 3.8 and will also be fully ionised at a pH of 7 [4]. Fluticasone propionate is very poorly water soluble (<1 µg mL−1) [5]
SX and FP are formulated both as dry powder inhalers and pressurised metered dose inhalers, individually or as a combination formulation. While validated assay methods have been reported for each drug individually and simultaneously [6], there are few methods for the simultaneous determination of all related substances of SX and FP in a lactose based dry powder formulation. A literature survey indicated that there is no related substance method for all 16 known impurities of salmeterol
and FP.
The British Pharmacopoeia (BP) published a fluticasone and salmeterol inhalation powder, pre-dispensed monograph. According to this monograph the method could separate only seven impurities from nine impurities of FP and five impurities from seven impurities of SX [7].
Yan C et al. [8] proposed an HPLC method of salmeterol and FP inhalation powder related substances determination with a Phenomenex Luna C18 column (25 cm x 4.6 mm, 5 μm). However, this method is not ideal. The method uses a different mobile phase and a higher column temperature, 40ºC, than the BP method but still results in a tailing factor for salmeterol peak greater than 1.3. Reducing the column temperature, results in the tailing becoming more severe which causes interference with the FP and salmeterol peaks for related substances [9].
The purpose of this study is to develop an HPLC method which can detect and separate all 16 known related substances of both salmeterol and FP, simultaneously. The difference between the proposed method from the BP and the literature methods relates to the solubilities of SX, FP and their impurities. The final method has been shown to be able to detect and separate all 16 known related substances (SX based impurities: A, B, C, D, E, F, G and FP based impurities A, B, C, D, E, F, G, H, I) with good linearity, accuracy and precision. The method was validated for 11 known related substances (SX based impurities D, G and FP based impurities A, B, C, D, E, F, G, H, I) because SX impurities are process based and as such were not required to be monitored. This proposed method has been successfully applied for routine analysis.
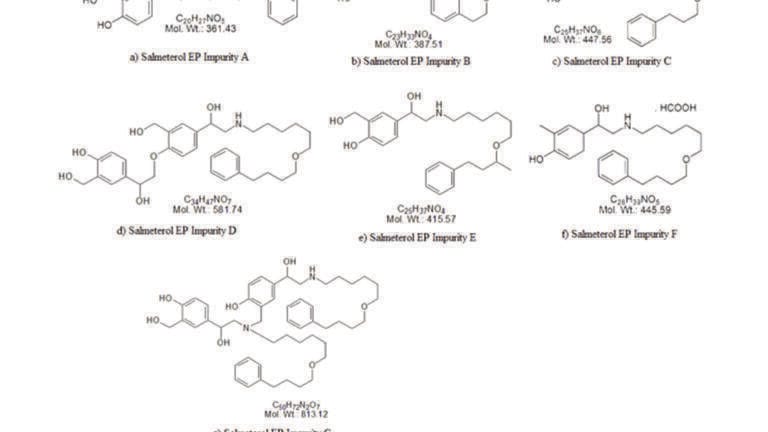
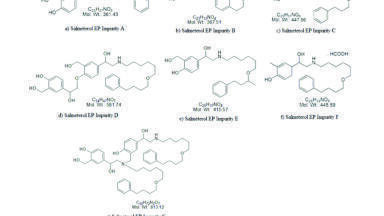
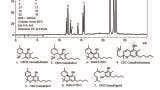
SX, FP and their related impurities were purchased from an API producer in Mumbai, India. Ammonium dihydrogen phosphate and phosphoric acid were purchased from Merck Ltd. HPLC grade acetonitrile and methanol were purchased from J.T.Baker. Deionised water was obtained from a Millipore, Milli-Q (Bedford, USA) purification system. Cyplos 50/500 mcg salmeterol/fluticasone propionate Sanohaler inhalation powder product (Sanovel, Turkey) was used as the finished product. All impurities are European pharmacopoeial impurities (Figure 1 and 2).
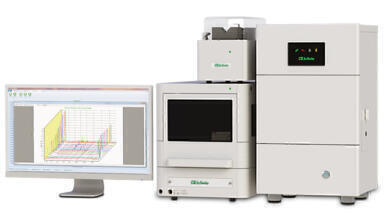
An HPLC system (Agilent, USA) equipped with inbuilt autosampler and quaternary gradient pump with an on-line degasser was used. The column compartment was temperature controlled and a PDA detector was employed throughout the analysis. Chromatographic data was acquired using Empower software.
A Hypersil BDS C8 (15 cm x 4.6 mm) 5 µm (Thermo Fisher Scientific, Runcorn, UK) column was used as the stationary phase and maintained at 30ºC in the thermostatically controlled oven. Mobile phase consisted of solvent A (0.1 M NH2PO4 buffer which was prepared as 11.5 g ammonium dihydrogen phosphate dissolved in 1000 mL of water and adjusted to a pH of 2.9 with orthophosphoric acid) and solvent B (acetonitrile). The mobile phase was pumped through the column at a flow rate of 2 mL/min (Table 1). The samples were made up in two solutions, diluent A or diluent B. Diluent A was a mixture of 0.05% phosphoric acid in methanol and water (70:30, v/v) and diluent B was a mixture of acetonitrile and diluent A (50:50, v/v).
An injection volume of 20 µL was used and the selected detection wavelength was 228 nm which is the optimal wavelength to ensure simultaneous determination of related impurities of SX and FP in Cyplos 50/500 mcg Salmeterol/Fluticasone Propionate Sanohaler inhalation powder.
Salmeterol related substances A, B, C, D, E, F and G were prepared separately by dissolving 2.0 mg of each impurity in diluent B and completing volume to 25 mL to yield a concentration of 0.08 mg/mL. Four mg of each FP related substances (A, B, C, D, E, F, G, H and I) were weighed into 5 mL volumetric flasks and completed to volume with diluent B to yield the final concentrations of FP impurities of 0.8 mg/mL.
Stock standard solutions for SX and FP were separately prepared by dissolving 29 mg of SX (equivalent to 20 mg Salmeterol) and 20 mg of FP in 100 mL volumetric flasks and diluting them to volume with diluent B to yield the final concentrations of solutions of 0.2 mg/mL. To obtain a mix standard solution, 0.25 mL from SX and 2.5 mL from FP stock standard solutions were pipetted out into a 20 mL volumetric flask and diluted to volume with diluent B. (CSalmeterol: 0.0025 mg/mL, CFP: 0.025 mg/mL).
500 mg sample from Cyplos Sanohaler 50/500 mcg (Salmeterol/Fluticasone Propionate) Inhalation Powder was weighed into a 10 mL volumetric flask, 5 mL acetonitrile was added and placed in and ultrasonic bath for 10 minutes to ensure dissolution. The resultant solution is diluted to volume with diluent A and ultrasonicated for a further 5 minutes. (CSalmeterol: 0.5 mg/mL, CFP : 5 mg/mL).
500 mg sample from Cyplos Sanohaler 50/500 mcg (Salmeterol / Fluticasone Propionate) Inhalation Powder (equivalent to 5 mg SX and 50 mg FP) was weighed into 10 mL volumetric flask. Then 0.1875 mL from each salmeterol related impurities (A, B, C, D, E, F and G) and 0.25 mL from each fluticasone propionate related impurities (A, B, C, D, E, F, G, H and I) were pipetted out onto powder and made up to volume with diluent B. (CSalmeterol: 0.0015 mg/mL, CFP: 0.02 mg/mL)
To ensure that the chromatographic system was in a suitable state, six replicate injections were made of SX and FP, ensuring that the relative standard deviations (RSD) for the SX and FP peak areas was not be more than 5.0%, with the tailing factor for SX and FP peaks less than 2.0 and finally, ensuring that the column efficiency (theoretical plates) for SX and FP peaks was greater than 2000.
Injections with different columns were conducted to determine the conditions required to obtain the best separation of analyte peaks and placebo peaks. The optimum peak shape, retention time, tailing factor, and column efficiency were obtained with a Hypersil BDS C8 column (15 cm x 4.6 mm, 5 µm).
Different compositions of mobile phase were tested to obtain sufficient selectivity and retention time for the analyte peaks. With ammonium dihydrogen phosphate buffer, high sensitivity and selectivity were achieved when compared with other buffers. The peak shape, peak symmetry, retention time and peak tailing when using 0.1 M ammonium dihydrogen phosphate were also found to be better than obtained using other buffers, so hence this buffer was used. Methanol and acetonitrile were both evaluated, with methanol producing a higher retention time, higher column back pressure and more peak tailing. It was decided to progress using acetonitrile as the organic modifier. Different gradient programs of 0.1 M buffer and organic solvents were also evaluated. After many trials, based on the peak shape, peak symmetry, retention time and peak tailing, the gradient profile, using a flow rate of 2 mL/min, shown in Table 1 was developed.
SX, FP and their related substance peaks were scanned between 200-400nm wavelengths by photo-diode array detector. A wavelength of 228 nm was found to be optimum for all analyte peaks.
Various trials on pH of the 0.1 M ammonium phosphate buffer were made to achieve the optimum pH at which all peaks related with APIs and impurities separated well. Based on peak shape, peak tailing and theoretical plate count, suitable pH of the buffer was found as 2.9.
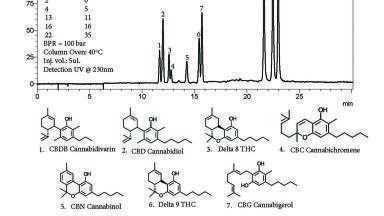
The optimised chromatographic conditions were selected as a gradient elution of buffer (0.1M NH2PO4, at pH2.9) and acetonitrile at 228 nm, 2.0 mL/min flowrate, 30º C column temperature and 20µL injection volume. A typical HPLC chromatogram (Figure 3) shows the separation of all 16 known related substances of SX and FP.
The developed method was validated according to the ICH Q2(R1) guideline [10] for various parameters such as specificity, precision, accuracy, linearity, robustness, limit of detection (LOD), limit of quantification (LOQ) and solution and mobile phase stability.
The peak purity indices for the impurity solutions were determined with PDA detector under optimised chromatographic conditions. The FDA guidelines indicated that well separated peaks, with resolution, Rs > 2 between the peak of interest and the closest eluting peak, are reliable for the quantification [11].
Peak purity indices (purity angle < purity threshold) were found as no additional peaks were co-eluting with the impurities. Baseline resolution was achieved for all investigated compounds. Complete and clear separation of all compounds was observed and there were no observable interferences in the chromatogram. The required resolution (Rs > 2) was achieved for all peaks, visibly confirmed in Figure 4.
Six series of standard solutions were selected to assess the linearity range. The calibration curve was plotted as peak area versus concentration of the standard solutions.
The nominal concentration of test solutions for SX and FP were 0.5 mg/mL and 5 mg/mL, respectively. Relative response factors were determined by preparing standard solutions for each impurity at different concentration levels ranging from LOQ concentration to 0.006 mg/mL for SX and its related substances, also to 0.06 mg/mL for FP and its related substances.
The y-intercepts were close to zero with their confidence intervals containing the origin. CDER recommends establishing the criterion of linearity at a level of the correlation coefficient r not lower than 0.999 [13]. As can be seen in Table 2, the correlation coefficients (r) are greater than 0.999, the acceptance threshold suggested for linearity of procedures for the determination of impurity content in bulk drug [12].
LOQ and LOD values for all 11 known related substances were determined based on signal-to-noise approach according to ICH guidelines. The results are tabulated in Table 3.
Reporting threshold was calculated based on the maximum daily intake of the drug and ICH Q3B(R2) [13]. According to ICH Q3B(R2), reporting threshold for maximum daily doses less than 1 g is given as 0.1%. Impurities found above the reporting threshold are reported.
The accuracy of the method was determined by recovery experiments. Recovery studies were carried out with six injections and four different concentrations. Known amounts for each related impurities corresponding to three concentration levels of LOQ, 30%, 100% and 120% of the specification level were spiked into sample solution. Three samples were prepared for each level. The experimental results (shown in Table 4) revealed that recoveries were obtained between 80% - 120% for all the investigated related compounds.
System precision studies were carried out by consecutively injecting the standard solutions for six times. Repeatability was studied by consecutively injection of six spiked test solution which are prepared separately. Intermediate precision was carried out by injecting six injections of standard and sample solutions within-laboratory variations: different days, different analysts, and different equipment. The relative standard deviation and difference between two analysts were calculated. The lower RSD% values (<5.00) indicate good precision of the developed method (Table 5).
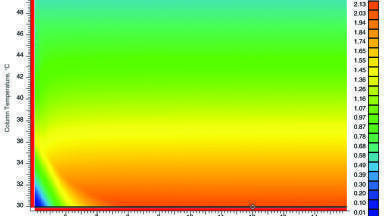
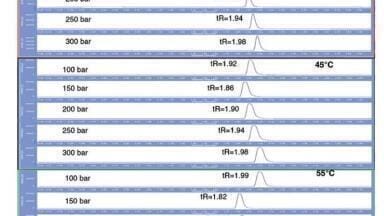
To demonstrate the robustness of the method, system suitability parameters was verified by making changes in chromatographic conditions, i.e. change in column temperature ± 2ºC, change in organic composition of mobile phase ± 2%, using different lots of columns. The retention time and the difference between the results at normal conditions and modified conditions were calculated. The spiked sample was injected and the resolution among all components was monitored. These experiments determined that the method is sensitive to changes in organic composition of mobile phase; however for all of the other parameters investigated the assay is robust
The stability of mobile phase, standard and sample solutions were carried out by keeping the solutions for 5 days and observing for changes in the area and the retention of the peaks, which were then compared with the pattern of the chromatogram of freshly prepared solutions. Relative difference (%) of known impurities was calculated based on the values of initial conditions, with the target being less than 5%. According to the stability study, the standard solution is stable for 118 hours and test solution is stable for 58 hours at 15ºC tray temperature, with the mobile phase being stable for 5 days in ambient conditions.
The proposed RP-HPLC impurity method for SX based impurities (D and G) and FP based impurities (A, B, C, D, E, F, G, H, I) was found accurate, precise, robust, specific and selective in the result of the performed validation studies. The method was validated as per ICH guidelines and it can be used for routine analysis of simultaneous quantification of 11 related substance of salmeterol xinafoate and fluticasone propionate in inhalation powder.
1. A. Samir, H. Salem, M. Abdelkawy, Simultaneous determination of salmeterol xinafoate and fluticasone propionate in bulk powder and Seritide® Diskus using high performance liquid chromatographic and spectrophotometric method, Pharmaceut. Anal. Acta. 50 (2012) 21–126.
2. HHY. Tong, BY. Shekunov, P. York, AHL. Chow, Characterization of two polymorphs of salmeterol xinafoate crystallized from supercritical fluids, Pharm. Res. 18 (2001) 852–858.
3. RP. Austin, P. Barton, A.M. Davis, C.N. Manners, M.C. Stansfield, The effect of ionic strength on liposome-buffer and 1-octanol-buffer distribution coefficients. J. Pharm. Sci. 87 (1998) 599–607.
4. J.D. Chanley, E. Feageson, Fe(III) complexes of o-Hydroxy aromatic acids, J. Am. Chem. Soc. 78 (1956) 2237–2241.
5. N.M. Davies, M.R. Feddah, A novel method for assessing dissolution of aerosol inhaler products, Int. J. Pharm. 255 (2003) 175–187.
6. V.G. Nayak, S.G. Belapure, C.D. Gaitonde, A.A. Sule, Determination of salmeterol in metered-dose and dry-powder inhalers by reversed-phase high performance liquid chromatography, J. Pharm. Biomed. Anal. 14 (1996) 511–513.
7. British Pharmacopoeia. Draft Monograph of fluticasone and salmeterol inhalation powder pre-dispensed. 2015.
8. C. Yan, W. Jiang, G. Chen, Y. Yang, L. Wang, HPLC determination of related substances salmeterol and fluticasone propionate powder for inhalation, Chin. J. Pharm. Anal. 30 (2010) 82-87.
9. T. Xuechun, C. Liying, L. Jing, Detection method for salmeterol fluticasone compound inhalant related substances, CN103134864 (A) - 2013-06-05
10. International Conference on Harmonization (ICH) Q2 (R1): Validation of Analytical Procedures—Test and Methodology. Geneva, Switzerland, 2005.
11. U.S. Food and Drug Administration, Center for Drug Evaluation Research (CDER). FDA, Reviewer Guidance: Validation of Chromatographic Methods. Washington; 1994.
12. K.B. Gajanan, F. Mazahar, Development and validation of a stability indicating RP-HPLC method for the simultaneous determination of related substances of albuterol sulfate and ipratropium bromide in nasal solution, J. Pharm. Biomed. Anal. 52 (2010) 19–29.
13. International Conference on Harmonization (ICH) Q3B(R2): Impurities in New Drug Products. Geneva, Switzerland, 2006.


-(1).jpg)