
HPLC, UHPLC
Published over 12 years ago. See the latest and most current information on HPLC, UHPLC.
Cyclosporine A, tacrolimus, sirolimus, and everolimus are four of the most commonly administered immunosuppressant drugs which play a central role in the success of tissue and organ transplants. These drugs are most typically analysed from whole blood using LC/MS/MS. However, because of the analytical challenges posed when working with whole blood, many of the published methods rely upon complex and/or expensive extraction steps utilising off-line solid-phase extraction, on-line solid-phase extraction, or the use of pre-columns prior to the actual analytical column. Reported in the work is a rapid and effective method for the analysis of these four immunosuppressants from whole blood that use a simple protein precipitation step followed by direct injection onto a wide-pore core-shell HPLC column (Aeris™ 3.6 µm XB-C18). The method displays excellent accuracy and is sensitive down to the low μg/L (ng/mL) range.
Introduction
Immunosuppressants are a class of drugs that inhibit the body’s immune response and are typically administered to prevent the rejection of transplanted organs (e.g. kidney) or tissue (e.g. bone marrow), and may also be used to treat various autoimmune disorders such as Crohn’s Disease or rheumatoid arthritis. The first effective immunosuppressant drug was cyclosporine A (or CsA), an undecapeptide initially discovered by researchers at the pharmaceutical company Sandoz [1]. Since the development of CsA, many other immunsuppressant drugs have been developed, including the macrolides tacrolimus (FK506), sirolimus (also known as rapamycin), and everolimus (Figure 1).
While all of these drugs ultimately act to suppress the immune response, they each exert their effects through different mechanisms. Cyclosporine A binds to the protein cyclophillin, and the resulting CsA-cyclophillin complex blocks the calcineurin-mediated transcription of the interleukin 2 (IL-2) gene in antigen activated T cells, thus preventing the growth, differentiation, and proliferation of T cells that mediate the immune response [2,3]. Tacrolimus binds to the protein FKBP12 (FK506 binding protein), and the resulting complex prevents the cascade of reactions that ultimately lead to a reduction in IL-2 transcription [3]. Unlike CsA and tacrolimus, which block synthesis of IL-2, sirolimus and everolimus exert their activity by blocking the response of T-cells to IL-2 [4].
Because of their potent immunosuppressant effects and relatively narrow therapeutic index, therapeutic drug monitoring of patients is required in order to ensure the efficacy of the treatment, and also to minimise toxic side effects [5, 6]. Liquid chromatography coupled to tandem mass spectrometry (LC/MS/MS) has become the analytical method of choice for the analysis of immunosuppressants. These drugs must be monitored from whole blood, which poses a sample preparation challenge as matrix effects can confound analyses through ion suppression and/or enhancement, and can also affect the reproducibility and accuracy of analytical methods. To overcome the challenges posed when working with whole blood, many methods that have been developed for immunosuppressant analysis involve off-line solid-phase extraction [7], which can be time-consuming and expensive, or complex on-line extraction methods that not all labs are equipped to operate [8, 9, 10]. Presented is a simple and rapid method for the analysis of immunosuppressants from whole blood that utilises a simple protein precipitation step followed directly by LC/MS/MS analysis using a wide-pore core-shell HPLC column. This fast, simple method shows excellent precision and accuracy down to the µg/L concentration range.
Materials and Methods
Reagents
The whole blood used in this study was obtained from Bioreclamation LLC (Westbury, NY). Methanol (LC/MS Grade) was purchased from J. T. Baker (Center Valley, PA). Deionised water was used for buffers and sample dilutions. Tacrolimus, everolimus, sirolimus, and cyclosporine A were from Sigma-Aldrich Chemical Co (St. Louis, MO, USA). The internal standard used for CsA was cyclosporine D (Cerilliant, Round Rock, TX), and the internal standard for the other immunosuppressants was ascomycin (Cerilliant). Unless stated otherwise, all other reagents used in this study were purchased from Sigma-Aldrich Chemical Co (St Louis, MO, USA).
Whole Blood Protein Precipitation
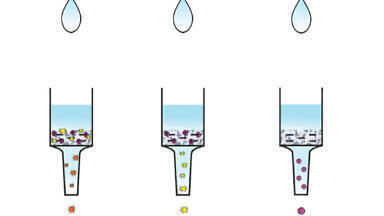
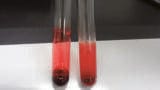
To perform the protein precipitation, 0.2 mL whole blood (spiked with analytes and internal standards) was placed into a 1.5 mL polypropylene microcentrifuge tube. 400 μL of 80:20 MeOH:2% zinc sulphate dissolved in water was added to the whole blood sample. This mixture was then vortexed vigorously for 10-20 seconds and then centrifuged at 14,000 rpm for 10 minutes at room temperature. The supernatant (~0.5 mL) was transferred to an autosampler vial, and then directly injected into the LC/MS/MS with a 20 µL injection volume.
Optional: Solid-Phase Extraction
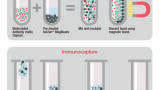
A simple method that uses protein precipitation and LC/MS/MS to analyse these immunosuppressants is presented. For users with LC/MS/MS systems that are not as sensitive as the API™ 5000 used in the current study, or for researches or analysts seeking much lower levels of detection and quantification, we also include an off-line solid-phase extraction method of cyclosporine A from whole blood. Using a vacuum manifold, a 30 mg/3 mL Strata™-X-CW (weak cation exchange) solid-phase extraction cartridge (Phenomenex, Torrance, CA.). This particular SPE sorbent chemistry was chosen as it gave the best balance of analyte recovery and sample cleanliness (data not shown). The cartridge was conditioned with 1 mL of 100% methanol, followed by 1 mL of 25 mM ammonium bicarbonate (pH 8.3). The protein precipitated whole blood sample was loaded onto the SPE bed and drawn through the SPE cartridge at a slow flow rate (~1 mL/min). The cartridge was then washed with 0.4 mL of the 25 mM ammonium bicarbonate, followed by a second wash using 0.4 mL of 50/50 methanol/water. Under high vacuum, the SPE bed was dried for 4-5 minutes, and then the analytes were eluted from the cartridge using 200 µL of 100% methanol. This elution step was repeated, and the resulting extracts were combined (400 μL) and evaporated to dryness under a gentle stream of nitrogen at 40-45°C. The extract residue was re-suspended with 400 μL of 35/65 methanol/ 5 mM ammonium formate (pH 3.2) and transferred to a glass autosampler vial for LC/MS/MS analysis.
LC/MS/MS Analysis
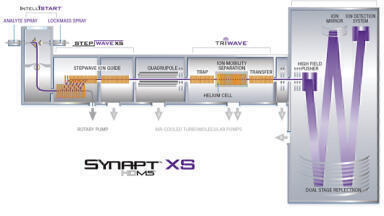
Analysis was performed using an API 5000 mass spectrometer (AB Sciex, Framingham, MA) coupled to an Agilent 1260 UHPLC system (Agilent Technologies; Santa Clara, CA).
The analytical column was an Aeris WIDEPORE 3.6 µm XB-C18 column (50mm x 2.1mm),
with a SecurityGuard™ Ultra guard cartridge (both from Phenomenex; Torrance, CA).
The Aeris Widepore column was selected from a column screen alongside smaller pore core-shell phases from the Kinetex range. The Aeris Widepore delivered the highest peak capacities and LODs/LOQs in the screen and was selected on that basis. This was possibly due to its narrower shell and improved diffusion properties. Mobile phase A consisted of 5 mM ammonium formate (no pH adjustment) dissolved in deionised water, and mobile phase B consisted of 5 mM ammonium formate dissolved in methanol. The analysis was performed using a simple, rapid gradient going from 35% B to 95%B over 1 minute, holding at 95% B for 1 minute, and then re-equilibrating at the initial 35% B for 2 minutes between injections. The flow rate was 700 µL per minute and the column temperature was maintained at 75°C. This temperature was chosen because the peak shape for CsA specifically was greatly improved by using an elevated temperature.
Multiple reaction monitoring (MRM) of the immunosuppressants was performed using electrospray in positive ion mode. The source was operated at 400°C with an electrospray voltage of 4000 V. Ion source parameters were as follows: curtain gas 25 L/min, GS1 60, GS2 45, CAD gas 10 L/min. MRM transitions for the analytes are shown in Table 1.
Results and Discussion
Chromatography
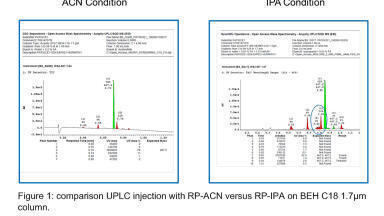
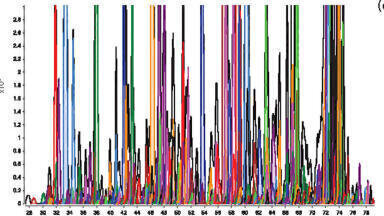
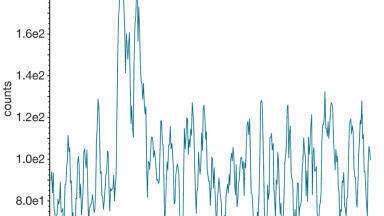
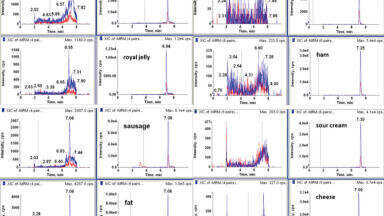
Figure 2 contains representative extracted ion chromatograms (XIC) for the MRMs of the selected immunosuppressants and the two internal standards obtained from a spiked, protein precipitated whole blood sample (50 ng/mL for everolimus, sirolimus, tacrolimus; 500 ng/mL for cyclosporine A). Flow before 0.8 minutes and after 2.5 minutes was diverted to waste. All of the immunosuppressants display excellent chromatography, and are eluted in cycle time of 4 minutes. The total elution window for the immunosuppressants is less than 1 minute, allowing for extremely high sample-throughput for analysts that utilise multiplexing technology. Comparison with the protein-precipitated matrix blank (Figure 3) shows little or no matrix interference for each for the MRM transitions monitored. Signal-to-noise ratio for each of the analytes at the lowest levels monitored were: CsA 140:1 (25 µg/L), tacrolimus 23:1 (2.5 µg/L), sirolimus 34:1 (2.5 µg/L), everolimus 13:1 (2.5 µg/L). Given the relatively high signal-to-noise ratios, it is clear that, if necessary, it would most likely be possible to accurately identify and quantify the target immunosuppressants at significantly lower levels than were used in the present study.
Quantification
Absolute recovery values (calculated based upon peak response factors against a spiked matrix blank) ranged from 73% for serolimus to 103% for tacrolimus, with RSD% values for four replicates sample preparations ranging between 1.3 and 8.8% (Table 2). Precision and accuracy values are given in Table 3 for high and low concentration QC samples. Accuracy values ranged from 85.4% to 114%, with precision (or imprecision) values of 6.00% or lower of four separate preparation.
The linear curve for CsA is shown in Figure 4. All of the immunosuppressants displayed excellent linearity over the ranges evaluated, with r2 values of 0.9990 or greater for each analyte. The concentration ranges in the study were: CsA 25-1000 µg/L (r2 = 0.9994), tacrolimus 2.5-100 µg/L (r2 = 0.9990), sirolimus 2.5-100 µg/L (r2 = 0.9992), and everolimus 2.5-100 µg/L (r2 = 0.9997). Ascomycin (100 µg/L) was used as an IS for the quantification of everolimus, sirolimus and tacrolimus. Cyclosporine D (100 µg/L) was used for the quantification of cyclosporine A for the same purpose.
Conclusions
In this work, a simple and effective method for the analysis of four commonly-used immunosuppressants obtained from whole blood samples was presented. Using a simple protein precipitation step, we were able to achieve a quantitation of 25 µg/L for CsA, 2.5 µg/L for tacrolimus, 2.5 µg/L for sirolimus, and 2.5 µg/L for everolimus. Signal-to-noise ratios at the lowest level analysed using this method were greater than 13, indicating that the method is most likely applicable to even lower levels of detection and quantitation. The use of a unique wide-pore core-shell column (Aeris 3.6 μm XB-C18) provided excellent chromatography for these relatively high molecular weight molecules, and also possesses a surface chemistry that is stable at the elevated temperate used in this assay (75°C).
References
1. S. Svarstad, H.C. Bugge, S.S Dhillion. Biodiversity and Conservation (2000) 9, 1521–1541.
2. S. Matsuda, S. Koyasu. Immunopharmacology (2000) 47, 119-125.
3. J. Liu, J. Farmer, W. Lane, J. Friedman, I. Weissman, S. Schreiber Cell (1991) 66, 807–815.
4. S.N. Seghal. Transplant Proc. (2003) 35, 7S-14S.
5. U. Christians, J. Klawitter, C.F. Clavijo. Kidney Int Suppl. (2010) 115, S1-7.
6. B. Kahan, P. Keown, G. Levy, A. Johnson Clinical Therapeutics (2002) 24, 330-350.
7. M. Karapirli, M. Kizilgun, O. Yesilyurt, H. Gul, Z.L. Kunak, E.O. Akgul, E. Macit, T. Cayci, K.Y. Gulcan, I. Aydin, H. Yaren, M. Seyrek, E. Cakir, H. Yaman Scientific World Journal (2012) 57 1201.
8. U. Christians, W. Jacobsen, N. Serkova, L.Z. Benet, C. Vidal, K.F. Sewing, M.P. Manns, G.I. Kirchner J Chromatogr. B (2000) 748, 41-53.
9. M. Deters, G. Kirchner, K. Resch, V. Kaever Clin. Chem. Lab. Med. (2002) 40, 285-292.
10. A. Buchwald, K. Winkler, T. Epting BMC Clin. Pharmacol. (2012) Jan 11;12:2. doi: 10.1186/1472-6904-12-2.


-(1).jpg)