HPLC, UHPLC
Published over 6 years ago. See the latest and most current information on HPLC, UHPLC.
The demands for increasingly fast chromatographic separations are unceasing as high-throughput methodologies are continuously sought and implemented in almost every analytical laboratory environment [1]. The pharmaceutical industry, for example, depends on fast analyses in order to speed the discovery and development of new drugs. Due to the complexity of biological targets, newly designed chemical entities often have one or more chiral centres, and, given certain FDA regulations, there is great need for fast assessment of enantiopurity and the feasibility of scaling for preparative purification. Chiral chromatography has long served as a reliable method for such analyses, but one of the major obstacles to the development of fast methods is the difficulty of predicting which chiral stationary phases (CSPs) will resolve the enantiomers of interest [2]. For this reason, samples are routinely screened against libraries of columns to determine which will perform best. This process often proceeds in a stepwise fashion and can be both manually intensive and time-consuming. To speed the process, labs have implemented automated, high-throughput screening approaches in order to identify promising CSPs before proceeding with further chromatographic method development. Such protocols may utilise instrumentation outfitted with 6- or 10- column selectors along with the ability to scout several mobile phases by incorporating quaternary pumping systems [3,4]. This approach also allows analysts to proceed with other tasks while chromatographic data is collected and processed over the course of a few hours or overnight. In certain environments, and dependent upon the number of samples to be evaluated, even these timeframes can be too long. Fortunately, advancements in instrumentation and column technologies have greatly improved the speeds and efficiencies of chromatographic separations over the past several decades and can help accelerate the screening process even further [1,5,6]. In particular, the use of smaller particles in packed columns is an especially effective means of decreasing analysis times while simultaneously maintaining or improving peak resolutions. In this study, we discuss and investigate some approaches to fast chiral column screening for both high-performance liquid chromatography (HPLC) and supercritical fluid chromatography (SFC) along with the practical applicability of those approaches. Given certain constraints with instrument capabilities (e.g. maximum pressures and flow) and extra-column volume variances, we rationalise the selection of appropriate column dimensions (length [L] and inner diameter [i.d.]). We also discuss the benefits and limitations of isocratic and gradient methods for fast screening and compare experimental results obtained with columns packed with 3- and 1.6-µm particles.
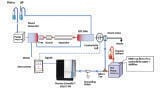
50 x 3.0 mm i.d., 3-µm Reflect™ I-Amylose A columns from Regis Technologies, Inc. were obtained, and 50 x 3.0 mm i.d., 1.6-µm CHIRALPAK® IA-U columns were purchased from Chiral Technologies, Inc. Both immobilizsed polysaccharide phases feature tris (3,5-dimethylphenylcarbamate) functionality and offer similar chromatographic selectivities. HPLC and SFC analyses were performed with a Shimadzu Nexera UC equipped with two LC-30AD pumps capable of delivering pressures up to 130 MPa (19,000 psi). One of these pumps was equipped with a low-pressure gradient unit for solvent selection. An LC-30ADSF pump delivered CO2 when operating in SFC mode. A semi-micro flow cell was used when operating in HPLC mode, and a high-pressure compatible SFC flow cell was used for SFC work with single wavelength UV detection. 0.1 mm i.d. tubing from the injection valve to the column inlet was installed, and column selection valves were bypassed to minimizse extra-column band broadening contributions.
HPLC grade hexane and isopropanol were obtained from Fisher Scientific, and HPLC grade methanol from EMD. Bone dry grade carbon dioxide was obtained from AirGas. HPLC grade ethanol, diethyl amine (DEA), and trifluoroacetic acid (TFA) were from Sigma-Aldrich. Samples, including 1-acenaphthenol, benzoin, bucetin, n-CBZ-valine, disopyramide, dropropizine, fenoterol, flavanone, flurbiprofen, hydrobenzoin, ibuprofen, ketamine, ketorolac, lansoprazole, linalool, meclizine, mepivacaine, metaproterenol, mianserin, nefopam, omeprazole, suprofen, trans stilbene oxide (TSO), Tröger’s Base, tropicamide, verapamil, and warfarin were obtained from Sigma-Aldrich. Chlormezanone was obtained from TCI, fenoxaprop-ethyl from Riedel-de Haën, and lofexidine from LKT Laboratories, Inc. Fenarimol, o-ethyl o-(4-nitrophenyl) phenylphosphonothioate (EPN), o,p’-DDD, o,p’-DDT, and triadimefon were acquired from Chem Service Inc. These compounds were selected to represent a range of chemical classes, including acids, bases, and neutral compounds.
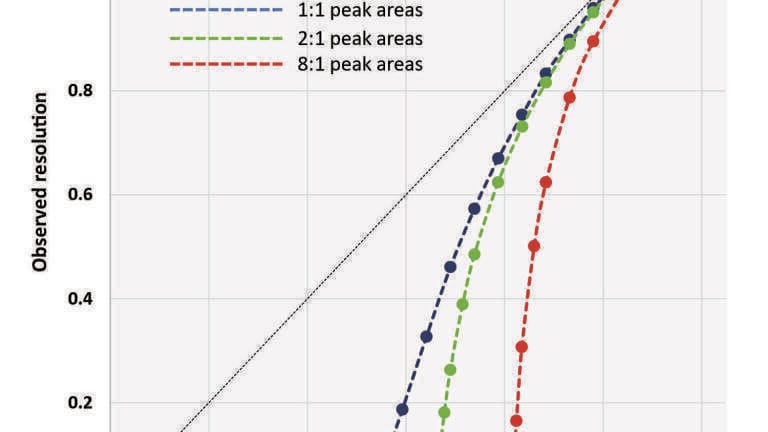
For each of the chiral separations, resolution (Rs) was calculated using the equation:
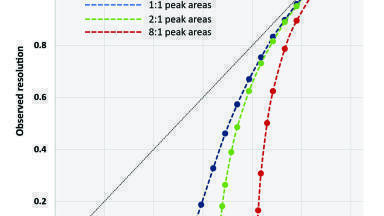
where t1 and t2 are the retention times, and w1 and w2 are the USP peak widths. When only partial resolution was observed, w and Rs were estimated using a perpendicular drop from the valley between the peaks to the baseline. When no valley was observable, resolution was estimated as Rs = 0. It should be noted that in instances of partial resolution, this approach can lead to significant underestimation of actual resolution. This is illustrated in Figure 1, where the theoretical relationships between observed resolution (as determined by this method) and actual resolution for two gaussian peaks (where Npeak,1 = Npeak,2) with peak area ratios of 1:1, 2:1 and 8:1 are plotted. Based upon the x-intercept calculated in this plot, an actual resolution of Rs ≈ 0.53 is required in order to achieve an observable valley with a distinct local minimum between peaks with 1:1 areas. Additionally, when partial resolution first becomes observable, very small changes in actual resolution result in relatively large changes to the calculated observed resolution. For example, with 1:1 peaks, a change in actual resolution from Rs = 0.544 to Rs = 0.593 (~9% increase) results in a calculated resolution change from Rs = 0.049 to Rs = 0.187 (~280% increase). The effect is even more significant when calculating the partial resolutions of peaks with unequal areas. The actual resolution of peaks with 8:1 areas must be Rs ≈ 0.81 before partial resolution becomes determinable by this method. All chiral compounds used in this study were racemic mixtures with enantiomeric ratios of approximately 1:1.
The use of smaller particles in packed column chromatography offers two primary advantages. First, column efficiencies (N) are improved through reductions of all terms (A, B, and C) in the van Deemter equation, and, second, maximum column efficiencies occur at faster optimum mobile phase velocities [5,7]. The cost of these advantages, however, is paid primarily through the operational pressures required to achieve them. For a given column length, a halving of particle size results in twice the efficiency in half the analysis time but requires 8 times the pressure. If these relationships are applied more specifically with an eye toward speeding analysis times, halving particle diameter allows for a column of half a given length to generate a given number of theoretical plates in a quarter of the time with 4 times the pressure. Another advantage is that, due to the lower C-term associated with smaller particles, analysis speeds can be increased well-beyond the optimum flow rate without serious consequence to efficiencies or peak resolutions. Therefore, the potential for using smaller particles to speed chiral column screening is obvious.
With that theoretical basis for using shorter columns packed with smaller particles to improve analysis speeds, their practicality, given certain instrument constraints, should also be considered. As mentioned, the instrument used to carry out the analysis must be capable of supplying the higher pressures associated with small particles. Equally important, the instrument must have an appropriately low volume variance so as not to nullify the efficiency gains provided by the column. The efficiency that an analyst observes with a given chromatographic separation is a function of the column’s intrinsic efficiency and the extra-column band broadening contributions of the instrument. These contributions arise from such things as the sample injection process, the pre- and post- column connection tubing, and the detector [8]. Instruments used for high-throughput screening often incorporate multi-column selectors, which introduce new sources of volume variance through additional valves and tubing. In order to observe a column’s true performance, the variance contribution of the instrument must be low relative to the volume variances of the eluting peaks. Peak volume variance, of course, is directly related to column volume and efficiency. From these values, the extent to which a given instrument variance will affect the observed isocratic efficiencies for a column of given dimensions (L x i.d; dp) can be estimated [7].
Consider the two different particle sizes used in this study. Assuming intrinsic reduced plate heights (h) of 2.5 for separate 5 cm columns packed with 3- and 1.6-µm particles, column efficiencies (N) of 6667 and 12,500 are expected, respectively. Given these values, the intrinsic peak volumes and their associated variances as they elute from columns with i.d.’s of 4.6, 3.0, and 2.1 mm can be calculated. As shown in Figure 2, those values can then be used to estimate observed efficiencies (Nobs) vs. analyte retention factor (k’) when collecting data on an instrument with a total variance contribution of 3 µL2, which falls within the range of current state-of-the-art UHPLC instrumentation [9]. With those band broadening contributions, a 50 x 4.6 mm i.d. column packed with 3-µm particles would exhibit an observed efficiency of approximately 99% its intrinsic efficiency (i.e. N ≈ 6,570) for a lightly retained analyte (k’ = 1). A 50 x 4.6 mm i.d. column packed with 1.6-µm particles generates narrower peaks that are slightly more affected by the instrument variance. It would exhibit an observed efficiency of approximately 97% its intrinsic efficiency (i.e. N ≈ 12,163) for an analyte with a retention factor of k’ = 1. On the other hand, 50 x 2.1 mm i.d. columns packed with 3- and 1.6-µm particles have approximately 4.8 times lower column volumes and would exhibit only 75% (N ≈ 4,975) and 61% (N ≈ 7,632) of their intrinsic efficiencies, respectively, when analyte k’ = 1.
The use of larger volume columns clearly renders extra-column variance contributions less significant, though there is an additional consideration when selecting column dimensions for fast chiral screening applications. This is especially true with high-throughput SFC screening that utilizses columns packed with small particles. As mentioned, a primary advantage of small particles is that they can be operated well beyond their optimum mobile phase linear velocities without serious detriment to column efficiencies. But with the low-viscosity mobile phases utilizsed in SFC, 4.6 mm i.d. columns packed with 1.6-µm particles may have optimum flow rates that exceed what many modern analytical CO2 pumps can provide, and the full advantage of such particle sizes may not be realizsed [10]. Such considerations should be informed by the user’s instrument specifications. For instance, the Nexera LC-30ADSF pump used in this study has a maximum pumping pressure of 66 MPa (9,752 psi) for flow rates up to 3.0 mL/min and drops to 44 MPa (6382 psi) when flowing between 3.0001 and 5.0 mL/min. When factoring in the additive ΔP drops across the column, the narrow connecting tubing, and the backpressure regulator, the combination of flow and pressure limitations of this pump does not allow for 4.6 mm i.d columns packed with 1.6-µm particles to be operated at appropriately high flow rates.
3.0 mm i.d. columns therefore present an acceptable balance when navigating the issues of extra-column band broadening effects and the flow/pressure limitations of commercial SFC instrumentation. From Figure 2, it can be seen that 50 x 3.0 mm i.d. columns packed with 3- and 1.6-µm particles still exhibit approximately 92% (N ≈ 6,164) and 87% (N ≈ 10,840) of their intrinsic column efficiencies, respectively, when operated on an instrument with a variance contribution of 3 µL2. And, given their respective column volumes, a 3.0 mm i.d. column has a mobile phase linear velocity approximately 2.35 times higher for a given flow rate, when compared to a 4.6 mm i.d. column. This allows 3.0 mm i.d. columns packed with small particles to be operated at appropriate linear velocities when using the Nexera LC-30ADSF pump without exceeding its pressure limitations. For these reasons, all experimental comparisons shown here were collected using 50 x 3.0 mm i.d. columns.
Prior to making any other comparisons, HPLC performance curves were constructed from plate height (H) vs. flow rate (F) data using the E2 peak of a trans stilbene oxide (TSO) sample solution while operating in 90/10 hexane/isopropanol. The plots in Figure 3(a) show that the 50 x 3.0 mm i.d. 1.6-µm column outperformed the 3-µm column, but not to the extent described by theory. The 3-µm column exhibited a maximum plate count N = 6,600 (h ≈ 2.5) at F = 0.4 mL/min, and the 1.6-µm column had a maximum plate count of N = 8,600 (h ≈ 3.6) at F = 0.4 mL/min. This performance was unrelated to system volume variance contributions, as confirmed through system suitability testing with a low volume 2.1 mm i.d. column. Rather, performance was likely the result of a heterogeneous packed-bed morphology, as numerous studies have highlighted the difficulties of packing sub-2-µm materials [11].Performance curves were likewise constructed in SFC mode using the same 3-µm column and a different 1.6-µm column. The E2 peak of trans stilbene oxide was characterizsed while operating in 90/10 CO2/isopropanol, and plots are shown in Figure 3(b). The 3-µm column exhibited a maximum efficiency N = 5,700 (h ≈ 2.9) at 1.0 mL/min, and the 1.6-µm column exhibited a maximum plate count N = 9,800 (h ≈ 3.2) at 1.25 mL/min.
At this time, the actual methods used to conduct high-throughput chiral screenings will be considered. Discussion will focus specifically on the advantages and disadvantages of isocratic and gradient methods. Run cycle time (i.e. the total time between subsequent sample injections) provides a good vantage from which to compare isocratic and gradient methods. Total cycle time is a function of several processes including: the time for the autosampler to draw and inject sample, the dead time (t0) of the column, the instrument dwell time, the gradient time or the time required to elute all sample peaks, column re-equilibration time, and computer processing time.
The most significant advantage of isocratic methods is the elimination of re-equilibration times, rendering total cycle time effectively subject to only the retentions of the peaks being analyzsed. The only remaining question is to decide the mobile phase composition. This determination is complicated by the wide range of retention properties likely present in large sets of samples. Lightly retained analytes benefit from analysis in weaker mobile phases, but the retention times of other analytes might become prohibitively long. Conversely, stronger mobile phases shorten retention times, but the resolutions of lightly retained analytes might be compromised or missed entirely. (At this point, it is worth mentioning the extremely fast, sub-second chiral separations that have been reported recently [12]. These isocratic separations were performed at high linear velocities with very short, 0.5 x 4.6 mm i.d. columns. These lengths allow for the use of relatively weak mobile phases while still maintaining reasonable retention times for even strongly retained compounds. In cases like this, autosampler times become the most significant contribution to total cycle time [13]. Routine implementation of this approach, given the volume variances of most high-throughput screening instrumentation along with other constraints, remains impractical in most laboratory settings.)
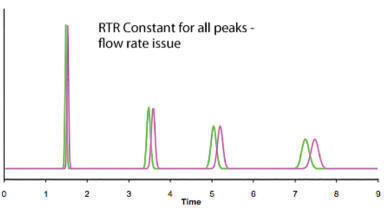
Gradient methods, on the other hand, start with low-strength mobile phase, which better allows for assessment of the CSP’s ability to resolve lightly retained analytes, and ramp to a stronger mobile phase to elute more highly retained compounds along with potential impurities [6, 14, 15]. This sets a fixed cycle time but gives rise to at least two factors worthy of consideration. First, because mobile phase composition and viscosity change with time, the operating pressure also changes. In normal-phase HPLC and SFC, where stronger mobile phases contain higher alcohol content, viscosity and pressure tend to increase through the course of a gradient. Analysts must be sure to not exceed either the maximum instrument pressure or the maximum column pressure as recommended by the manufacturer. Second, the use of mobile phase gradients frequently necessitates that a certain re-equilibration period be built into the method, which adds to total cycle time. Without appropriate re-equilibration time, peak retentions may be irreproducible or enantioresolutions (i.e. “‘hits”) ’) may be missed. The question of how long the re-equilibration period should be is influenced by several factors, including the delay time (determined by instrument dwell volume) and the nature of the analyses being performed [16]. For fast chiral screening where the goal is to identify the most appropriate CSP with which to proceed with further method development, full re-equilibration, which can take 20 –- 30 column volumes equating to several minutes or in some cases hours, may not be necessary [17-19]. Rather, partial re-equilibration, wherewith highly repeatable separations are still obtained, may be enough. We characterizsed the effects of re-equilibration times on the Nexera UC for both HPLC and SFC gradient methods with respect to retention time and resolution reproducibilities using a 50 x 3.0 mm, 3-µm Reflect I-Amylose A column.
A gradient HPLC method, described in Figure 4, was used to probe the effect of method re-equilibration time. Analyses were made in triplicate for 0.5-µL injections of a sample containing both racemic mianserin and dropropizine. Programmed re-equilibration times were 0, 0.1, 0.5, 1.0, 2.0, 3.0, and 10 minutes. These programmed times correspond to approximately 0, 0.4, 2.0, 4.0, 8.1, 12.1, and 40.4 column volumes when operating a 50 x 3.mm i.d. column at 1.0 mL/min. It also should be noted that these times do not include the approximately 40 second autosampler cycle time (i.e. the period between the end of the previous method and the injection of the subsequent sample), which corresponds to an additional 2.7 column volumes. The effects of programmed equilibration time on the retentions of both enantiomers of mianserin and droproazine are plotted in Figure 4(a) and (b), respectively. There is a small increase in retention for enantiomers of both compounds with increased equilibration time before levelling off at 0.5 minutes and beyond. Likewise, resolution (Rs) of both enantiomers increased with re-equilibration time before also levelling off at 0.5 minutes, as shown in Figure 4(c) and (d). The effect, as expected, is larger with the earlier eluting mianserin, but, as suggested by the error, is very reproducible. A 30 second re-equilibration was therefore included with all gradient HPLC methods run at 1 mL/min in this study.
Similarly, a gradient SFC method, described in Figure 5, was used to probe the effects of re-equilibration time. Analyses were made in triplicate for 0.2-µL injections of a sample containing both racemic ketamine and dropropizine. Programmed re-equilibration times were 0, 0.1, 0.5, 1.0, 2.0, 3.0, 5.0, and 10 minutes. At 1.5 mL/min, these times correspond to 0, 0.6, 3.0, 6.1, 12.1, 18.2, 30.3, and 60.6 column volumes, respectively. Again, these times do not include the ~40 second autosampler cycle time, which corresponds to approximately 4 column volumes at this flow rate. The effects of programmed re-equilibration time on SFC retentions and resolutions are similar to the HPLC trends described above. Figures 5(a) and (b) plot the retention times for ketamine and dropropizine, respectively, and there is little change in either case. The most notable effect is observed in the resolution of the ketamine enantiomers, shown in Figure 5(c) which increases with re-equilibration time. The increase is small, but significant, and a 2-minute re-equilibration was therefore included with all gradient SFC methods run at 1.5 mL/min in this study.
After characterizsing the kinetic performances of each 50 x 3.0 mm i.d. column as described earlier, columns were compared using both isocratic and gradient elution methods for the chiral separations of 35 racemic compounds. Appropriate isocratic HPLC mobile phase conditions to balance both hit-rates (i.e. the number of enantioresolutions or partial resolutions) and method runtimes were scouted. Separations were performed at 1 mL/min in each of four mobile phases: 80/20 hexane/ethanol, 45/55 hexane/ethanol, 80/20 hexane/isopropanol, and 45/55 hexane/isopropanol (v/v). To improve the peak shapes of ionizsable species, 0.1% TFA was added to the mobile phases for separations of acidic compounds n-CBZ-valine, flurbiprofen, ibuprofen, ketorolac, and suprofen, and 0.1% DEA was added to the mobile phases for separations of basic compounds disopyramide, dropropizine, fenoterol, ketamine, lansoprazole, lofexidine, meclizine, mepivacaine, metaproterenol, mianserin, nefopam, and verapamil. With the 3-µm column, 26 of 35 racemates exhibited at least partial resolution when using 20% ethanol, but only 16 hits were seen when using 55% ethanol. Similarly, 25 hits were observed when using 20% IPA, and 18 when using 55% IPA. With the 1.6-µm column, 27 and 21 hits were observed when running with 20% and 55% ethanol, respectively. 29 and 18 hits were noted when running with 20% and 55% IPA. Additional hits were observable when weaker mobile phases were used, but the retention times of certain compounds (e.g. chlormezanone, omeprazole) became prohibitively long. For these reasons, the data collected for mobile phases with 80/20 hexane/alcohol were used for further comparisons.
The only compounds to exhibit no determinable resolution with either mobile phase composition were ketamine and mepivacaine. For the 50 x 3.0 mm i.d., 1.6-µm column, 27 and 29 hits were observed with 80/20 hexane/ethanol and 80/20 hexane/IPA, respectively. Once again, however, ketamine and mepivacaine were not resolved with either mobile phase. From a theoretical basis, the 1.6-µm column should provide approximately twice as many theoretical plates as the 3-µm column, thereby improving resolution by √2 times (~ 41% higher), but as described earlier, those theoretical efficiency gains were not observed. At 1 mL/min, the 1.6-µm column had approximately 1.65 times higher efficiency than the 3-µm column, so a 28% increase in resolution could be estimated barring any selectivity differences between the two columns.
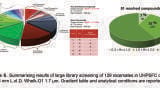
Visual comparisons of the resolutions for all 35 racemates are shown in Figure 6 for 80/20 hexane/ethanol. A minimum increase in Rs value of at least 28% was observed with the 1.6-µm column for 7 of the separations performed with 80/20 hexane/ethanol, including one case (i.e. lofexidine) where partial resolution was observed and none was calculable with the 3-µm column. In the separation of verapamil, the 3-µm column provided a resolution Rs = 0.18 and the 1.6-µm column a resolution Rs = 0.64, a 256% improvement. But, as pointed out in the Experimental section, small increases in actual resolution register as large differences in observed resolution when a local minimum between two peaks first becomes observable. From Figure 1, the observed efficiencies with the two columns translate from Rs = 0.18 and Rs = 0.64 to estimated actual resolutions of Rs = 0.59 and Rs = 0.77, respectively. This is a significant improvement of approximately 31%, but not nearly as dramatic as originally calculated. It also must be acknowledged that it can be difficult to deconvolute the contributions of efficiency and selectivity in their respective influences on peak resolution. This is perhaps apparent in the five cases where observed resolution was higher with the 3-µm column.
The same analysis was applied to the 80/20 hexane/IPA separations, as shown in Figure 7. The resolutions achieved with the 1.6-µm column were at least 28% higher for 13 of the separations, including three cases when partial resolution was observed and none was calculable with the 3-µm column. Again, however, the influences of selectivity complicate matters, and there are 8 instances where the 3-µm column provided superior resolution, including one case of partial resolution that was not observed with the 1.6-µm column.
Gradient separations were performed with both columns using hexane/alcohol mobile phases. A 1.5-minute gradient from 5-55% alcohol with a 0.5 minute hold at 55% was used in attempt to address the issues of low resolution for early-eluting compounds and long retention times for certain others. With the 50 x 3.0 mm i.d., 3-µm Reflect I-Amylose A column, 28 hits were observed when using ethanol as the modifier, and compared to the isocratic separations in 80/20 hexane/ethanol, resolution was improved with the gradient method in all but four cases. Similarly, 27 hits were observed with the gradient IPA method, and resolution was better in all but three cases when compared to the isocratic separations in 80/20 hexane/IPA. With the gradient approach, between the two modifiers, at least partial resolution was achieved for all 35 compounds.
With the 50 x 3.0 mm i.d, 1.6-µm CHIRALPAK IA-U column, 32 and 28 hits were observed with the gradient methods when using ethanol and IPA, respectively. Once again, resolutions were improved in the vast majority of the gradient separations as compared to the isocratic data. The exceptions are generally later-eluting compounds. Two of these compounds, chlormezanone and omeprazole, experience significant portions of the 55% B isocratic hold, which accounts for their lower resolutions when compared to the 20% B isocratic separations. As with the 3-µm column, the gradient approach provides at least partial resolution of all 35 compounds.
Figure 8 shows the maximum Rs values that were obtained for each column-compound combination with the gradient method, regardless of alcoholic modifier. For example, the resolution values of 1-acenaphthenol were obtained with the IPA gradient, while the resolutions shown for dropropizine were obtained with the ethanol gradient. There were no instances when ethanol gave better resolution for a compound with the 3-µm column while IPA provided better resolution with the 1.6-µm column, or vice versa. Since column efficiency as well as gradient steepness both contribute to the quality of the separation, a 20% change in resolution was arbitrarily deemed worthy to be noted. In summarizsing the findings, there were nine compounds for which the resolution was at least 20% higher with the 1.6-µm column, and six compounds for which the resolution was 20% higher with the 3-µm column.
This data does not present a particularly strong case for the adoption of 1.6-µm particle packed columns for the purposes of high-throughput chiral column screening. Rather, a potential disadvantage was revealed upon re-evaluation of each column’s kinetic performance once all the above-described data was collected. HPLC performance curves, H vs. F, were constructed with the same conditions used to evaluate the newly received columns. Prior to any gradient use, the 50 x 3.0 mm i.d., 3-µm column gave plate heights of H = 8.07 µm and H = 9.27 µm for the E2 peak of TSO at 0.4 and 1.0 mL/min, respectively. After extensive use, the same column gave plate heights of 7.57 µm and 8.88 µm at those same flow rates. The 50 x 3.0 mm i.d., 1.6-µm column gave plates heights of 5.81 µm and 7.76 µm at 0.4 and 1.0 mL/min when new. After use, the column showed deteriorated performance with plate heights of 6.74 µm and 9.11 µm at the same respective flow rates, likely resulting from shifts in the column’s packing structure over the course of many injections. While operating pressure never exceeded the manufacturer’s recommended maximum pressure of 700 bar (10,150 psi), the column was subjected to pressure cycles which took the column from ~2,900 psi to ~6,700 psi during the 5-55% IPA gradient runs. The column packed with 3-µm particles experienced only a quarter of these pressures, and performance was preserved.
50 x 3.0 mm i.d. columns packed with 3- and 1.6-µm particles were similarly evaluated in SFC mode with isocratic and gradient methods. Methanol and isopropanol were individually screened as alcoholic modifiers, and 0.2% DEA was added when separating basic compounds. Using 80/20 CO2/methanol, 29 of the 35 compounds were at least partially resolved with both the 3- and 1.6-µm columns while operating at 1.5 mL/min. With 80/20 CO2/IPA, the 3-µm column provided 25 hits, and the 1.6-µm column gave hits for 28 compounds. Neither column provided hits for 1-acenaphthenol or lofexidine with either mobile phase.
Gradient methods were performed at 1.5 mL/min with a 1.0-minute gradient from 5-55% B and 0.33 minute hold. Once again, both methanol and IPA were screened as alcohol modifiers. Overall, gradient methods yielded higher resolutions compared to the isocratic separations for 19 of 33 compounds with the 3-µm column, and for 18 of 34 compounds with the 1.6-µm column. The resolutions of earlier-eluting compounds tended to improve with gradient methods because they experienced weaker average mobile phase conditions while still on column. Figure 9 shows the maximum Rs values that were obtained for each column-compound combination with the gradient SFC method, regardless of alcoholic modifier. There was one instance when methanol gave better resolution for a compound (EPN) with the 3-µm column while IPA provided better resolution with the 1.6-µm column. Overall, there were eight compounds for which the resolution was at least 20% higher with the 1.6-µm column, and one compounds for which the resolution was 20% higher with the 3-µm column.
After performing the above-described experiments, the SFC efficiencies of both columns were re-evaluated and compared to the original values. Neither column exhibited significant performance losses. At this point, 23 of the 35 test compounds (neutrals and acids) were selected to assess gradient performance of the columns at 3 mL/min with methanol modifier. With this doubling of flow rate, all gradient times were halved (i.e. 5-55% MeOH in 0.5 minutes, 0.17 minute hold at 55%). It should be noted that, for the 1.6-µm column, BPR pressure was reduced from 150 bar (2,175 psi) to 125 bar (1,813 psi) so as to not exceed the maximum pressure capability of the LC-30ADSF CO2 pump. Resolutions were compared against those obtained when running at 1.5 mL/min, and results for the 3-µm and 1.6-µm columns are shown in Figures 10 and 11, respectively. A visual inspection of the figures shows that the faster gradient resulted in lower resolution of all compounds, and that the extent of the relative losses were similar for both columns. Excluding 1-acenaphthenol, which was unresolved by the 3-µm column, the average % losses of resolution exhibited by the 3- and 1.6-µm columns were 17.0 ± 6.8% and 17.3 ± 9.4%, respectively. Thus viewed, there was no advantage of the 1.6-µm column over the 3-µm column in its ability to preserve peak resolution at higher flow rates.
During these 3 mL/min; 5-55% methanol gradients, the pump pressure increased from 220 to 300 bar (3,200 to 4,400 psi) with the BPR set at 150 bar (2,175 psi) while using the 50 x 3.0 mm i.d., 3-µm column. With the 50 x 3.0 mm i.d., 1.6-µm column, pump pressure increased from 290 to 586 bar (4,200 – 8,500 psi) with the BPR set at 125 bar (1,813 psi). As in the case of the HPLC study described above, this pressure cycling resulted in performance losses for the 1.6-µm column. Before being subjected to higher pressures, the column generated plate heights of H = 5.12 µm and 6.10 µm at flow rates of 1.25 and 2.25 mL/min, respectively. After high-pressure use, plate heights of H = 6.95 µm and 7.29 µm were observed at the same respective flow rates. The 3-µm column exhibited no efficiency losses after testing at 3 mL/min.
In this study, we reviewed the primary theoretical advantages of using shorter columns packed with smaller particles to improve chromatographic analysis times and efficiencies. These advantages permit for higher-throughput analyses in all laboratory settings, and we specifically discussed applicability to high-throughput chiral screening. Given constraints in instrument pumping capabilities and the influences of extra-column volume variances, we rationalizsed the selection of 50 x 3.0 mm i.d. columns for fast screening approaches. The advantages and disadvantages of isocratic and gradient methods were examined with respect to the selection of appropriate mobile phase strengths and the influence of re-equilibration times in both HPLC and SFC. Finally, we compared 50 x 3.0 mm i.d. columns packed with 3- and 1.6-µm particles and their abilities to provide hits with a set of 35 racemic compounds.
From the obtained hit rates and resolution values, little advantage was observed when using 1.6-µm particles compared to 3-µm particles. In HPLC mode, each of the 35 racemates was at least partially resolved on both columns when using a gradient method. While it is difficult to fully account for the role of selectivity differences between the two particle types, there was no clear indication of efficiency benefits with the smaller particles. Nine compounds had at least 20% better resolution with the 1.6-µm particles, and six had at least 20% better resolution with the 3-µm particles. In gradient SFC mode, the 1.6-µm column partially resolved one additional compound (1-acenaphthenol; Rs = 0.01) that was not resolved with the 3-µm column. When the columns were operated at a faster flow rate (3 vs. 1.5 mL/min), both exhibited similar compound resolution losses. Finally, the 50 x 3.0 mm i.d., 1.6-µm columns showed significant performance losses after use at high pressure. The 50 x 3.0 mm i.d., 3-µm column, which experienced approximately 400% lower pressures with the same flow and gradient conditions, did not exhibit such losses. Of course, these findings are not a universal indictment of the use of sub-2µm particles; there are innumerable examples of their value for fast chromatographic analyses. Rather, this study highlights the current need for an accurate accounting of potential benefits and challenges when using such materials for high-throughput chiral screening. Steady, generational improvements in instrument design and column packing approaches will serve to address many of the difficulties pointed out in this work [1, 20].
1. A.S. Kaplitz, G.A. Kresge, B. Selover, L. Horvat, E.G. Franklin, J.M. Godinho, K.M. Grinias, S.W. Foster, J.J. Davis, J.P. Grinias, Anal. Chem. 92 (2020) 67.
2. L. Nováková, M. Douša. Anal. Chim. Acta. 950 (2017) 199.
3. H. Wang, H.R. Lhotka, R. Bennett, M. Potapenko, C.J. Pickens, B.F. Mann, I.A. Haidar Ahmad, E.L. Regalado, J Chromatogr. A In Press, https://doi.org/10.1016/j.chroma.2020.460895
4. J. Lin, C. Tsang, R. Lieu, K. Zhang, J Chromatogr. A, In Press, https://doi.org/10.1016/j.chroma.2020.460987
5. C. Hamman, M. Wong, M. Hayes, P. Gibbons. J. Chromatogr. A. 1218 (2011) 3529.
6. W. Schafer, T. Chandrasekaran, Z. Pirzada, C. Zhang, X. Gong, M. Biba, E.L. Regalado, C.J. Welch. Chirality. 25 (2013) 799.
7. U. Neue. HPLC Columns: Theory, Technology, and Practice. Wiley-VCH, Inc.: New York, NY (1997).
8. A. Prüß, C. Kempter, J. Gysler, and T. Jira, J. Chromatogr. A 1016 (2003) 129.
9. J. De Vos, K. Broekhoven, S. Eeltink. Anal. Chem. 88 (2016) 262.
10. T.A. Berger. Supercritical Fluid Chromatography: Primer. Agilent Technologies, Inc. (2015)
11. F. Gritti, M.F. Wahab. LCGC N. Amer. 36 (2018) 82.
12. M.F. Wahab, R.M. Wimalasinghe, Y. Wang, C.L. Barhate, D.C. Patel, D.W. Armstrong. Anal. Chem. 88 (2016) 8821.
13. C.J. Welch, X. Gong, W. Schafer, E.C. Pratt, T. Brkovic, Z. Pirzada, J. Cuff, B. Kosjek. Tetrahedron: Asymmetry. 21 (2010) 1674.
14. C.L. Barhate, L.A. Joyce, A.A. Makarov, K. Zawatzky, F. Bernardoni, W.A. Schafer, D.W. Armstrong, C.J. Welch, E.L. Regalado. Chem. Commun. 53 (2017) 509.
15. M.L. de la Puente, C.T. White, A. Rivera-Sagredo, J. Reilly, K. Burton, G. Harvey. J. Chromatogr. A. 983 (2003) 101.
16. J. Dolan. LCGC N. Amer. 21 (2003) 968.
17. J.C. Heaton, N.W. Smith, D.V. McCalley. Anal. Chim. Acta. 1045 (2019) 141.
18. D.V. McCalley. J. Chromatogr. A. 1554 (2018) 61.
19. D.R. Stoll, C. Seidl. LCGC N. Amer. 37 (2019) 790.
20. T.A. Berger. Chromatography Today. Aug/Sep (2018) 4.


-(1).jpg)