Data handling
Published over 5 years ago. See the latest and most current information on Data handling.
CHARIS LAM, ACD/LABS
How do you understand your chromatographic space? For most modern chromatographers, modelling is the answer.
But all modelling isn’t made equal.
Question 1: Does your model match reality?
A model is only as useful as its relationship to reality.
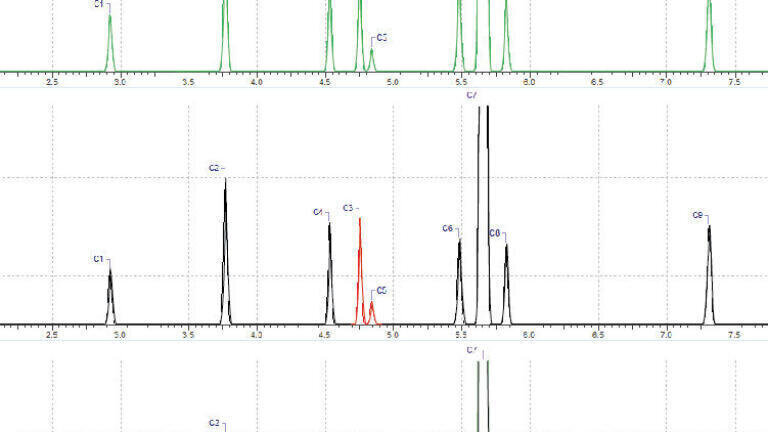
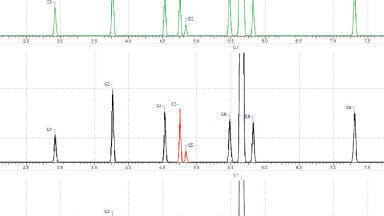
To check your model’s quality, overlay your simulated and experimental chromatograms. In the example on the right, the green chromatogram is simulated; the black/red one is experimental. The bottom shows both together: they overlap almost completely.
Next, graph the predicted and experimental retention times against each other. Is the relationship linear? Is the standard deviation low?
What if the answer is ‘no’?
Check whether the modelling equations can be changed. Some method development software, like ACD/Method Selection Suite, lets you adjust equations. Method Selection Suite also suggests the best equations for specific scenarios, but tweaking may improve your simulation.
Question 2: Does your model map sufficient space?
You might have heard the story of the man searching for his keys beneath the streetlamp because ‘that’s where the light is’. (Twist: He dropped his keys across the street.) That can happen if you’re optimising too few parameters, or if you’re optimising one-at-a-time. You’ll miss segments of your design space, which might include the method optima.
So how many parameters should you optimise together?
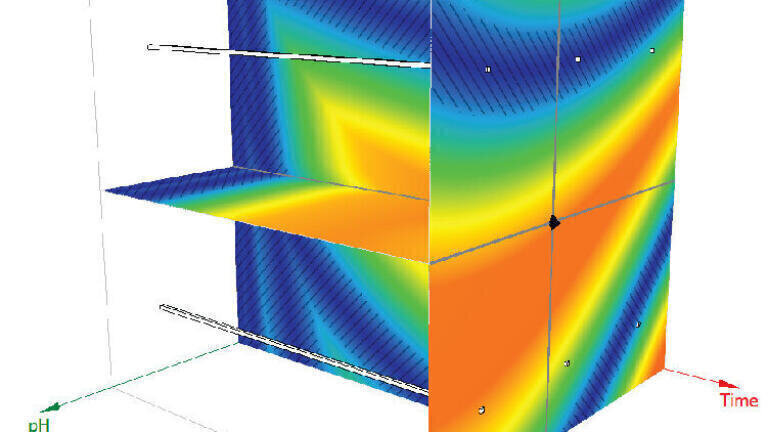
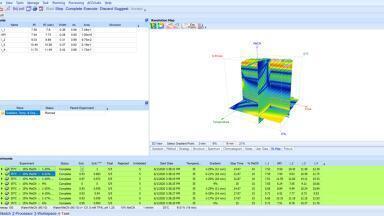
Three is often a good compromise between experiment number and model coverage. Bonus: It’s easy to visualise. See the example to the right.
A good visualisation is worth a thousand numbers. Zooming, rotating, and scrolling through the planes will help you see how resolution changes with your modelled parameters.
Remember: reviewing your model is as important as making it. Choose software like Method Selection Suite to help, or make a note to always give your optimisation a critical check.


-(1).jpg)