Bioanalytical
Published over 5 years ago. See the latest and most current information on Bioanalytical.
Eleven honey samples were tested, and triplicate analyses were done for each. To mimic fraudulent honey products and asses the ability of the method to detect corn syrup adulteration, an experiment was performed in which honey samples were diluted with a series of increasing corn syrup concentrations, up to and including 100% corn syrup by mass, prior to sample extraction. Analysis was performed using the SCIEX X500R QTOF system, operated in both positive and negative polarity modes. The data independent acquisition strategy was used, with SWATH® Acquisition employed in order to collect high resolution precursor and product spectral information for all ionisable constituents in the samples. Endogenous species such as flavones and phenols are also able to be characterised as part of a profile of different honey varieties, by using the same SWATH data and statistical approach. Implications of this work extend to both honey authenticity testing as well as product quality assurance and ‘omics’ type discovery work on natural products.
Demand for honey is global, and the supply of this commodity is being challenged by diminishing production and bee colony collapse. Likely, these factors have contributed to honey being ranked in sixth place amongst the ten most frequently adulterated food items by the European Commission in 2013 [1]. Honey adulteration remains a significant concern with a rising number of cases of fraudulent products or labelling [2, 3].
A common way honey is adulterated by dilution with cheaper syrups produced from substances such as high-fructose corn syrups.
Dilution, along with fraudulent labelling, can occur in instances where honey products have disparate value due to rarity or other unique properties. Screening for such fraudulent or adulterated products involves analysing different physicochemical parameters or morphological assessments. Examples include morphological pollen analysis for the botanical origin of honey or the C4 isotope test for the presence of corn-derived sugars. But each of these current practices has limitations in feasibility or scaling; a method which can find multiple markers for adulteration with minimal preparation and reduces subjectivity in the data processing would allow for greater confidence and reliability in screening honey products for imposters.
A workflow which allows for the screening of many honey samples for target markers of fraudulent dilution represents a unique and advantageous approach to this problem. In the world of analytical mass spectrometry, and indeed in other areas of food testing, a targeted approach, which involves testing for known chemical species, leverages multiple reaction monitoring (MRM) data acquired on a triple quadrupole mass spectrometer. This is often treated as the ‘gold standard’ in data quality and quantitative performance. However, it necessitates that the targets being screened for are already known. So before an MRM method can become a standard practice for adulterant detection, we must first discover what the target species for identifying fraudulent honey should be.
Using a mass spectrometer with high mass resolution and mass accuracy, a nontargeted workflow was developed. Common in the ‘omics’ disciplines, this type of approach intends to identify and characterise reliable marker compounds. These data could then be transferred to a targeted approach for routine monitoring [4]. By collecting high-resolution mass spectral data using sequential window acquisition of all theoretical fragment ion spectra mass spectrometry (SWATH Acquisition) data-independent acquisition on a Quadrupole Time-of-Flight System (SCIEX X500R QTOF), it is possible to profile large numbers of components across samples to characterise different floral origins of honey, as well as identify honey which has been diluted with corn syrup.
A spectral library of natural compounds (SCIEX Natural Products Library 2.0) was used to identify some of the characteristic components of different honey samples and see how these components’ occurrence vary between honey origins. The verified MS/MS library allows for the rapid deployment of this nontargeted approach. Furthermore, there is a capacity to append new compounds to this library.
Honey samples were collected from local producers, and represented a range of different origins of production. The sample variety was important to ensure that different floral types of honey products were captured, to explore the capacity of the method for characterisation of product profiling. In addition, experiments were designed to mimic fraudulent honey products by diluting the samples with corn syrup, and the ability of the method to detect markers of adulteration was assessed. This involved a series of increasing corn syrup dilution levels, up to and including 100% corn syrup by mass.
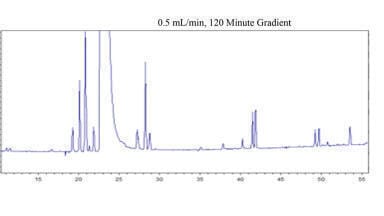
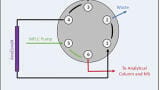
Reverse-phase liquid chromatography was employed for separation, and used a UHPLC system (ExionLC™ AD LC, SCIEX) for sample introduction to the QTOF system. Separation was achieved using a Phenomenex Luna Omega Polar C18 (150×4.6 mm, 3 um) analytical column. This column performs well for retention and separation of low molecular weight and highly polar species. A flow rate of 0.3 mL/min was used, as it is compatible with this particle size. Combined with the long gradient (45 minutes) this is a typical approach for truly nontargeted analysis in which establishing good peak profile elution and resolution means getting the highest quality spectral data from the data-independent acquisition (DIA) strategy.
Mobile phases consisted of 0.1% formic acid in water (A) and 0.1% formic acid in methanol (B) at a flow rate of 1 mL/min and a column temperature of 25°C. The chromatographic time gradient is shown in Table 1.
For MS, the SCIEX X500R QTOF system was operated in both positive and negative polarity modes. The following MS source conditions were used.
SWATH, a data-independent strategy for acquiring spectral data on compounds in the sample, was employed to obtain high-quality MS/MS spectra with 38 different precursor mass windows. The accumulation for the TOF MS is 0.1 sec and the accumulation time for the TOF MS/MS is 0.025 sec. Data processing involved statistical analysis using MarkerView software (MarkerView Software, SCIEX), and qualitative compound identifications using the natural products spectral library.
Differentiating between honey variants with Principal Component Analysis (PCA)
In this workflow, the statistical analysis software will first pick all the features present in the TOF MS data, each feature identified as an m/z and retention time pair. The feature profiles across the different samples can then be statistically compared to find differences between sample sets and identify features which are uniquely present (up-regulated) or uniquely absent (down-regulated) in a particular sample. A principal component analysis (PCA) is a common approach to visualising how these feature profiles distinguish sample sets from each other, and was used to show the chemical differentiation of the honey samples from different floral origins. In Figure 1, the PCA plot demonstrates how honey from clover, orange blossom, and wildflower mix, are all chemically different from each other and form clusters on the PCA plot. This indicates that these have chemical signatures unique to each floral origins. Additionally, pure corn syrup clusters separately from the honeys in the plot as well, indicating that there are chemical differences between corn syrup and honey that this method is able to detect and measure.
Figure 1 also shows corn syrup data in the same PCA plot. It can be seen that that corn syrup has a highly differentiated profile from the honey samples in that its clusters far from the authentic honey in the PCA plot. In practical applications, this type of analysis may serve two foreseeable purposes: to compare an unknown honey sample against a model built from data acquired for a large population of known authentic samples, or to profile honey to investigate unique markers which may be present in different products of varying origins or processes.
Investigating unique markers using t-test
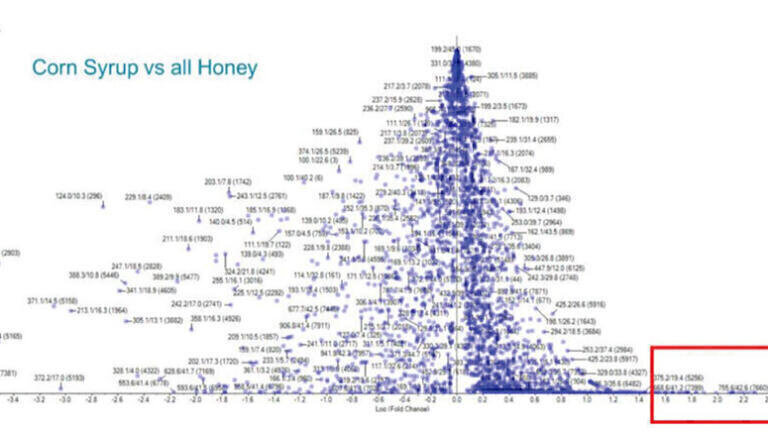
A t-test was performed to make a pair-wise comparison of all the classes, using m/z features to represent unique markers. The t-test indicates how well each variable distinguishes the two groups, and plotting a volcano plot of the m/z features (Figure 2) can allow for quickvisualisation of the difference in signal (log fold change between the two compared sets) and greatest statistical significance (lowest p-value).
Library searching for compound candidate ID
A primary advantage of acquiring data using SWATH Acquisition is the collection of MS/MS spectral information for every detectable precursor in the defined mass range. This allows product ion spectral information to be searched and verified in our database.
A Natural Products Library, was utilised to identify some of the characteristic components of the different honey samples and see how these components’ occurrence varied between honey origins. Table 3 shows seven natural products identified with a match score of at least 75 out of 100 in at least one honey sample. The corresponding mass error for all was within 5ppm (most within 1ppm except when the level was very close to noise).
These seven natural products identified in the honey samples were then imported into SCIEX OS Software as a targeted components list. These targeted components list could then be applied to honey samples to achieve relative quantitation of these species in the different honey varietals. Figure 3 shows the amount of each of these compounds as represented by the chromatographic peak area in the different kinds of honey as well as in the corn syrup and extraction blank. While the profile of these flavonoids and other compounds varies between honey types, they do not appear to be present in either corn syrup or extraction blank. Different honey samples appear to have different polyphenol profiles. Error bars represent a standard deviation about the mean of triplicate analyses.
The PCA and t-test analyses allowed for the evaluation of features unique to the corn syrup versus all honeys. Four of these features with the greatest signal intensity were selected. A series of dilutions of a honey sample with corn syrup was used to demonstrate the ability to plot the response of these m/z features and thus illustrate a quantitative capacity to measure honey dilution with corn syrup. While the exact structure identification of these four compound features is unknown, the workflow proposed in this study was employed to achieve this information and be able to show this potential for developing methods for accurate honey screening. Figure 4 shows how the response of these features drops predictably with decreasing corn syrup dilution. This suggests that marker features discovered using nontargeted QTOF methods can transfer to targeted screening methods utilising MRM data, or that characteristic features of other common adulterants might also be discovered.
Key findings from the study:
• SWATH Acquisition allows for the collection of spectral data for all ionisable, detectable constituents in the honey sample
• Data can be used to profile honey commodities and identify unique chemical markers
• The selected software and validated MS/MS library allow for the tentative identification of naturally occurring constituents in honey
• MarkerView Software with PCA and t-test statistical analyses to find differentiating chemical features in the complex honey and corn syrup matrices
• Shows that markers unique to corn syrup can be identified and used to screen and quantify dilution of honey products with corn syrup (Figure 4)
This study shows the potential for using a QTOF system to investigate honey chemical profiles and develop targets for adulterant screening. The proof of concept demonstrated by this proposed workflow can not only help determine the chemical “fingerprint” of a honey blend but also detect and identify possible fraudulent compounds. Exploration of both endogenous natural products and introduced adulterants alike is demonstrated. This mass spectrometric approach represents significant increase in versatility and reliability over current practices.
1. European Commission, REPORT on the food crisis, fraud in the food chain and the control thereof (2013/2091(INI))
2. EU RASFF Portal https://webgate.ec.europa.eu/rasff-window/portal/
3. European Commission, Monthly summary of articles on food fraud and adulteration https://ec.europa.eu/knowledge4policy/sites/know4pol/files/food_fraud_newsletter_03-2020.pdf
4. Cajka, T., M.R. Showalter, K. Riddellova, O. Fiehn. (2016) Advances in Mass Spectrometry for Food Authenticity Testing: An Omics Perspective. In Woodhead Publishing Series in Food Science, Technology and Nutrition, 171-200.
5. Lan X., Wang W., Li Q., J. Wang. (2016) The Natural Flavonoid Pinocembrin: Molecular Targets and Potential Therapeutic Applications. Mol Neurobiol. 53(3), 1794.
6. Cianciosi D., Forbes-Hernández, T.Y., S. Afrin, et al. (2018) Phenolic Compounds in Honey and Their Associated Health Benefits: A Review. Molecules. 23(9), 2322.
7. Kimura, Y., Takahashi, S.; Yoshida, I. (1968) Studies on the constituents of Alpinia. XII. On the constituents of the seeds of Alpinia katsumadai hayata. I. The structure of cardamomin. Yakugaku Zasshi: J. Pharm. Soc. Japan 88(2), 239.
8. Noh, D., Choi, J., Huh, E., M. Oh. (2018) Tectorigenin, a Flavonoid-Based Compound of Leopard Lily Rhizome, Attenuates UV-B-Induced Apoptosis and Collagen Degradation by Inhibiting Oxidative Stress in Human Keratinocytes. Nutrients. 10(12), 1998
9. Technical note on Honey Authenticity Analysis: A Proposed Workflow Using the SCIEX X500R QTOF System https://sciex.com/Documents/tech%20notes/2019/honey-authenticity-analysis-x500r.pdf
The SCIEX clinical diagnostic portfolio is For In Vitro Diagnostic Use. Rx Only. Product(s) not available in all countries. For information on availability, please contact your local sales representative or refer to https://sciex.com/diagnostics. All other products are For Research Use Only. Not for use in Diagnostic Procedures.
Trademarks and/or registered trademarks mentioned herein, including associated logos, are the property of AB Sciex Pte. Ltd. or their respective owners in the United States and/or certain other countries.
© 2020 DH Tech. Dev. Pte. Ltd. Related to RUO-MKT-02-10468-A.