Supercritical fluid (SFC), green chromatography
Published over 9 years ago. See the latest and most current information on Supercritical fluid (SFC), green chromatography.
Supercritical Fluid Chromatography (SFC) has re-emerged as a first-rate technique for purification of candidate drugs in the pharmaceutical industry; fuelled by new and improved instrumentation and a rapidly growing interest in the scientific community. SFC is considered much more complex and difficult than HPLC by new users but that is largely compensated for by strong advantages such as lower environmental impact and the much shorter separation times and thus larger production rates. However, there are remaining challenges and difficulties with packed column SFC, the most studied are those resulting from the compressibility of the mobile phase, leading to the concept that SFC is a ‘rubber variant’ of HPLC, where everything considered constant in HPLC, is not in SFC. In this article we will discuss and review, with new and review materials another challenge not often addressed in SFC - the fact that sample components cannot be dissolved in the mobile phase, but have to be dissolved in a solvent, and what type of peak distortions that may generate.
Supercritical Fluid Chromatography (SFC) in the Preparative mode (Prep-SFC) is a most environmentally friendly purification method [1]. Instead of using harmful solvents as in Preparative Liquid Chromatography (Prep-LC), environmentally friendly supercritical fluids, such as carbon dioxide which already exist in the bio-cycle, and is used in SFC. However, in SFC we have not reached the level of expertise and knowledge achieved in the area of nonlinear separation theory in LC. There are many issues encountered with preparative packed column SFC we still do not fully understand, or that we simply apply Prep-LC knowledge to.
The main reason why Prep-SFC is more complex than Prep-LC is due to the increased compressibility of the mobile phase. It can be said that SFC is a ‘rubber variant’ of LC where everything considered constant in LC is not constant in SFC [1-5]. This ultimately results in radial and axial density and temperature gradients in the column that affect the thermodynamics of adsorption and cause a volumetric flow rate gradient through the column [1-5]. Therefore, the ‘set’ operational conditions do not necessary reflect the correct ‘real’ conditions experienced in practice. The differences of certain parameters such as external operational and column conditions such as column temperature, pressure, flow, density, eluent composition external to the column are irrelevant while other conditions related to the internal column conditions are of utmost importance [2,3]. Fundamental studies therefore require the use of external sensors for pressure, temperature and mass flow, especially if the studies are aimed at reliable method transfer and scale up from analytical to preparative scale.
A recent study on the dependences of the adsorption on the mobile phase composition were investigated using a chemometric Design of Experiments (DoE) approach [3]. Using this approach, we were able to study the combined effect of temperature, pressure and co-solvent fraction in analytical and preparative SFC. More specifically, by using DoE, careful measurements of the experimental conditions and properly selected racemic model compounds, we could investigate how productivity, selectivity and retention in chiral SFC depended on pressure, temperature and co-solvent fraction [3]. Among others we found that the productivity for preparative SFC was most influenced by the co-solvent fraction and the column temperature, where high co-solvent fraction and temperature gave maximum productivity in the studied design space [3]. For reliable computer-assisted optimisation of a preparative SFC units’ production, a reliable method for the determination of adsorption isotherms in SFC are required along with proper mathematical models for the SFC experiments. Some recent work applying well-known LC adsorption isotherm determination methods to SFC found that the methods that worked best for SFC were often the worst ones for LC [4,5].
A recent investigation on performing reliable method transfer from analytical pilot scale to large scale SFC purification was also performed [6] where we came across the fact that most analytical instruments are volume-controlled while most preparative scale units are mass-controlled. This problem was solved by measuring the mass flow, the pressure and the temperature on the analytical unit using external sensors. The analytical scale SFC experiments were performed in our research laboratory and then we used these experiments to calculate the correct operational conditions for scale-up. Our calculations were verified using a large scale process unit at AstraZeneca R&D Mölndal, Sweden and the results from the large scale unit agreed well with those from our analytical unit [6].
It was mentioned above that the compressibility of the mobile phase is a main reason for SFC being more complex than LC but there is another important problem, resulting in complex behaviour, in SFC due to the fact that we cannot easily dissolve the solute component in a carbon dioxide (CO2) based mobile phase, only in the co-solvent. This has the consequence that the sample solvent introduced at the top of the column will have a composition that deviates strongly from that of the mobile phase. The fact that the sample cannot be readily dissolved in the mobile phase in SFC and must instead be dissolved in pure organic co-solvent or a similar liquid is an important problem having strong impact on the eluted band profiles. We have found that there are principally three different reasons for peak distortion upon injection of a sample dissolved in the co-solvent. Only one of these is generally known, called ‘the plug effect’ and is due to the solvent strength – mobile phase mismatch [7]. We will give some examples of the ‘plug effects’ as well as the other putative distortion effects due to the injection in SFC.
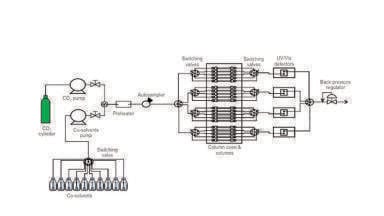
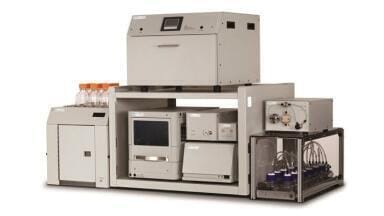
The column employed was a Kromasil Diol 60 Angstrom, 5 micron (150 x 4.6 mm) and mobile phase was comprised of carbon dioxide with several different compositions of methanol (MeOH). The SFC system was a Waters UPC2 system (Waters Corporation, Milford, MA, USA) equipped with a diode array detector (DAD) and a Waters single quadrupole mass spectrometer (SQD), using either APCI or ESI in positive mode. The injected solute peaks were measured with both the DAD and the SQD and was manually tuned for single ion recording to detect Deuterated MeOH molecules. The solutes injected were of analytical grade, the column temperature was 40°C, and the back pressure regulator (BPR) was set to 140 bar if not otherwise noted.
In SFC the sample cannot readily be dissolved in the CO2 based mobile phase, so it is often dissolved in a strong organic solvent, or in the co-solvent itself. This presents a series of complications; the most obvious one being that the injection will result in solvent strength and mobile phase strength mismatches. The mismatches often result in more or less serious distortions of the eluted peak profiles. These combined effects are often described as ‘plug effects’ and are illustrated below. It is important before describing ‘plug effects’ to describe the two main injection modes in SFC.
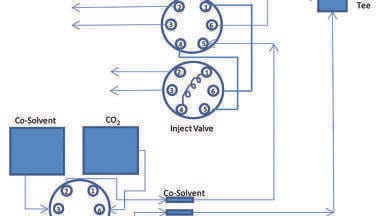
In SFC there are two main injection techniques the so called mixed-stream injection mode and the modifier stream injection mode [7,8], respectively. Figure 1a shows the principle of the mixed-stream injection mode which is actually the same principle as in ordinary HPLC; the injection is performed just prior to the column, after that the CO2 stream is mixed with the modifier (i.e. the co-solvent). Figure 1b shows the principle of the modifier-stream injection mode; here the injection is made in the modifier-stream, which is then mixed with the CO2 stream (Figure 1b). The advantages and disadvantages of the respective technique were previously evaluated in preparative SFC by Miller and Sebastian [9] and by Yun and Rajendran [8]. However, the mixed-stream injection mode (Figure 1a) is the most commonly used injection mode in commercial SFC instruments.
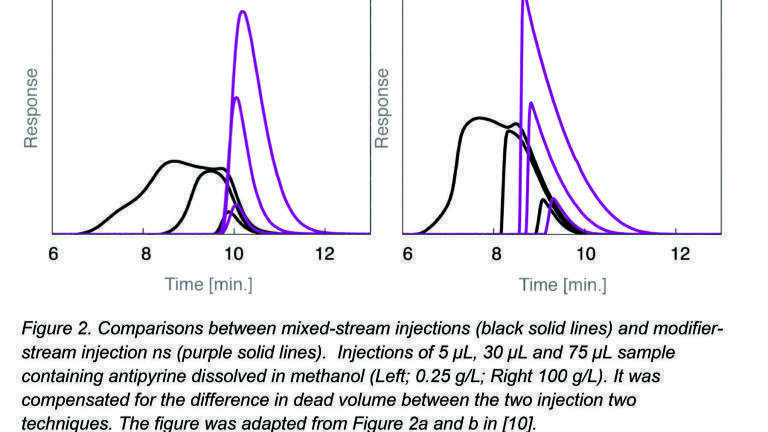
Recently we investigated the origin of peak deformation due to injection solvent effects in SFC, using both systematic experiments and numerical modelling [10]. The experiments proved that the injection volume and the elution strength of the sample solution had a major impact of the shapes of the eluted peaks.
Our experiments showed that the peak distortion without doubt results from the so called ‘plug effects’. Normally an SFC mobile phase contains 5-10% co-solvent in the main component, i.e. carbon dioxide. When the solute is dissolved in 100% co-solvent, the local mobile phase composition in the sample plug at the column inlet will have considerably larger elution power than the bulk mobile phase, causing strong deformations. This is especially the case for the larger injection volumes we systematically studied.
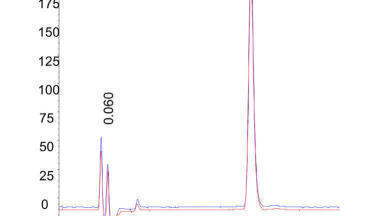
Figure 2a shows a series of injections made from a 0.25 g / L solution of antipyrine analysed on identical SFC systems but using the two different injection modes. Injection volumes were varied from 5 µL to 75 µL; the purple lines showed the resulting band profiles using the modifier stream injection mode and the black lines the resulting band profiles using the mixed stream injection mode. In Figure 2b under identical conditions we injected the same sample volumes of a much more concentrated antipyrine solution (100 g/L). Figure 2a and b together show clearly that the ‘plug effect’ takes place only in the mixed-stream injection mode and not in the modifier stream injection mode.
In the latter case (purple lines in Figure 2a
and b) there will be no sample solvent – mobile phase solvent mismatch since the sample is introduced into the modifier-stream prior to the mixing point between carbon dioxide and modifier. These observed peak distortions will have the most pronounced effects at preparative-scale injection volumes [10]. In analytical situations smaller volumes are injected so much smaller distortion effects are expected.
After completion of the experimental set described above, the sample band elution profiles were numerically modelled on a theoretical basis assuming both un-retained and retained co-solvent injection plugs, respectively [10]. These calculations quantitatively confirmed our first set of experiments but also pointed out that there might be an additional significant effect when accounting numerically for the plug effect for antipyrine injections using an eluent containing 7.2%v/v MeOH (Figure 5 in [10]). We suspected these extra contributions to peak distortion were due to sample – mobile phase viscosity mismatches, so called viscous effects [11]. In order to prove our hypothesis, in cooperation with Professor Shalliker, we used transparent columns and visualised with his cameras what happens inside the chromatographic separation with LC experiments ‘imitating’ the same viscosity contrast as was the case in the SFC experiment (Figure 5 in [10]).
The viscosity contrast between eluent (with 7.2% v/v MeOH) and injection solvent in the SFC experiment was calculated to be around 3.8 times. To experimentally visualise viscosity effects of this magnitude we used a 5 mm I.D. LC column packed with a 5µm C18 silica phase and equilibrated with 45/55% v/v dichloromethane/toluene, which correspond to a viscosity contrast 0.38 cP [10]. This mobile phase has the same refractive index as the C18 silica. Cyclohexanol has a very high viscosity, and the same refractive index as the stationary phase. Hence the viscosity of the mobile phase can be easily adjusted simply by adding cyclohexanol to the dichloromethane/toluene mixture. The injection was visualised by adding an un-retained coloured dye to the sample. Two LC experiments were conducted; the first with no viscosity contrast between the eluent and the sample solution, see Figure 3a. The second experiment was performed such that there was a viscosity contrast between the injection solvent and the mobile phase of approximately 3.8 times, see Figure 3b, thus imitating the SFC experiment where we had an additional deformation, Figure 5 in [10].
The sample zone in the column without viscosity contrast, Figure 3a, is more or less bullet-shaped whereas this is not the case when there was a viscosity contrast (cf. Figure 3b). From inspection of these images we can clearly see that the sample zone was distorted and severely tailing and this would drastically broaden the elution zone of the injection solvent.
Recent investigation has shown that the MeOH co-solvent adsorbs very strongly to silica [12] and diol [13] stationary phases. We have found that when the MeOH co-solvent adsorbs more strongly to the stationary phase than the solute, unusual peak deformations of the preparative bands can occur. The normal Langmuirian shaped bands may turn to anti-Langmuirian shapes when changing from neat (pure) carbon dioxide to an eluent containing co-solvent. Such strange overloaded elution profiles have previously only been investigated and explained in LC when a strongly adsorbing, often ionic, additive is in the eluent [14,15].
If such an effect takes place there can be a band transition from the overloaded solute band having a Langmuir band shapes to an anti-Langmuir band shapes depending on the fraction of the modifier in the eluent plateau: so far this effect has only been observed and described in rare LC systems [14,15]. However, two requirements must be fulfilled [15] for this phenomena to take place; firstly, the mobile phase must contain an additive that adsorbs stronger to the stationary phase than the solute. This can be checked for by injecting small amounts of both additive and the respective solutes in a LC system. It is imperative that this LC system utilises a mobile phase lacking the additive being studied as well as possesses a detector capable of quantifying not only the solute but also the additive component. If the additive peak injected under such conditions has a greater retention time than that of the solute, that is a proof of that the additive adsorbs stronger than the solute. The second requirement for this strange phenomena to take place is related to the situation when the additive has been added to the mobile phase of a certain concentration plateau level and is actually acting as an additive. Under such circumstances we have a constant stream of additive along the column. This means that an equilibrium is established of the additive between the stationary and mobile phases for the particular plateau concentration level of additive. Now, in this situation, the injection of the sample containing large amount of solute, will disturb the established equilibria of the additive in the column generation a positive displacement additive zone which if detected is called perturbation peak by the chemical engineering community and system peak by the analytical separation community [15]. The second requirement for this band deformation effect due to a strong additive to take place is that this perturbation peak of the additive is made to elute before the actual solute peak. This seems at a first glance paradoxical regarding the fact that the first requirement is that additive component itself should have as a stronger degree of adsorption as compared to the solute in a mobile phase lacking additive (see requirement one above). But this can actually easily be achieved by increasing properly the plateau concentration level of the additive and the reason for that is that according to the separation theory the retention of a perturbation peak generally decreases faster than a solute peak with increased plateau concentration. The underlying more complicated reason for this is that the perturbation peak is more ‘a wave phenomena’, than a moving mass [15]. To summarise if both requirements described above are fulfilled, the overloaded solute elution band turns from overloaded Langmuirian shape with a steep front and diffuse rear to being anti-Langmuiran shaped (diffuse front, steep rear) [15].
The question is if this strange phenomena that cannot take place in common LC separations (only in rare LC separations containing strong additives) can in fact take place in our most common SFC systems? The question is most relevant since recent investigations showing the common co-solvent MeOH adsorbed strongly to common SFC stationary phases [14,15].
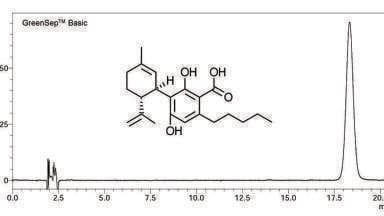
The answer is yes as we can see in the following and which will be explained in more detail and for more various SFC systems at the SPICA 2016 meeting [16]. In Figure 4 we can see that this is in fact the case in SFC and that the peak deformation effect is due to strongly adsorbing MeOH co-solvent according to the general requirements described above. In Figure 4 we inject different injection volumes of a highly concentrated valerophenone (i.e. the solute) solution at different concentrations of MeOH in the mobile phase, going from neat carbon dioxide to a concentration plateau level of 7.3% MeOH (cf. Figure 4). The injection volumes were kept small between 2 and 10 µL in order to avoid the plug effect (cf. Figure 2) taking place at larger injection volumes, but the sample concentration was very large (100 g/L) in order to guarantee overloaded effects. When going from 0, to 6.2% and then further to 7.3% MeOH eluent fractions, the corresponding solute elution profiles are turning from having Langmuir shape at lower MeOH fractions to having a more rounded shape at the 6.2% MeOH fractions to having a clear anti-Langmuir shape at 7.3% MeOH (cf. Figure 4). This is in perfect agreement with the previous LC theory [15]. When we compare the logarithms of the retention factors of the 6.2% MeOH fraction peak with that of the perturbation peak of the additive (see Figure 5) we can see that the at 0% MeOH fraction the strongly adsorbing additive has a perturbation peak with a larger (extrapolated) retention factor than that of the solute, while at the 6.2% MeOH fraction, when the overloaded solute band shapes are rounder as predicted according to the LC investigations, the retention factors of the solute and perturbation peak are very close to each other [16]. Most interestingly, at slightly higher MeOH fraction 7.3%, a level at which the overloaded valerophenone band profile has turned from Langmuir to an anti-Langmuir shape (cf. Figure 4), the MeOH perturbation peak has passed and has a smaller retention factor compared to the solute peak of valerophenone (cf. Figure 5). This is in a clear agreement with the LC theory described above for the retention behaviour of a perturbation peak versus an ordinary solute peak. The fact that the co-solvent MeOH appears to adsorbs much stronger to a diol bonded silica than MeOH adsorbed to a reversed phase C18 column infers that the peak distortion effects due to a strong additive (co-solvent) should be a much more common problem SFC, this is not confirmed yet and these early results must be systematically examined in future studies.
Systematic investigations - using both systematic experiments and numerical modelling – were performed to find the origin of the peak distortions due to the injection solvent effects in SFC using the mixed-stream injection mode. The first set of experiments (see Figure 2a and b, above) proved that the injection volume and the elution strength of the sample solution had a major impact on the shapes of the eluted peaks. Secondly, the sample band elution profile was numerically modelled on a theoretical basis assuming both un-retained and retained co-solvent injection plugs, respectively. These calculations quantitatively confirmed our first set of experiments but also pointed out that there is also an additional significant effect. Viscous fingering experiments were performed using viscosity contrast conditions imitating those encountered in SFC. These experiments clearly proved that viscous fingering effects play a significant role.
A third, but no less serious, source for peak deformation in SFC was just discovered as a logical consequence of the latter recent adsorption studies done of MeOH on common SFC phases [12,13]. We could also suggest a third more serious reason for peak distortions probably more important than the sample solvent – mobile phase viscosity contrast mismatch. This is a special type of deformation of overloaded band profiles that has so far only been demonstrated in LC before and here due to unusually strongly adsorbing additives, not to the modifier in LC. More particular when this strong additive in LC adsorbs stronger than the solute to the stationary phase when combined with such high additive levels in the eluent that its perturbation peak elutes before the solute peak then a very unusual phenomena takes place; namely that the Langmuir shaped (sharp front, diffuse rear) overloaded solute profile turns from Langmuir shape to anti-Langmuir shape (diffuse front, sharp rear). This is exactly what happens for the solute valerophenone; its overloaded band shape converts from a normal ‘Langmuirian’ band shape to an ‘anti-Langmuirian’ shape when changing from neat (pure) carbon dioxide (CO2) to an eluent containing co-solvent (cf. Figure 4). This new explanation for peak deformation in SFC is very premature and will be more systematically investigated and presented at our SPICA 2016 lecture [16].
This work, mostly the product of a collaboration between Emelie Glenne (PhD-student), Jörgen Samuelsson, PhD and Professor Torgny Fornstedt at the Fundamental Separation Science Group (www.separationscience.se) at Karlstad University and Hanna Leek, PhD, Kristina Öhlén, PhD and Director Magnus Klarqvist at AstraZeneca R&D, Molndal, Sweden, was supported by (i) the Swedish Knowledge Foundation for the KK HÖG 2014 project ‘SOMI: Studies of Molecular Interactions for Quality Assurance, Bio-Specific Measurement & Reliable Supercritical Purification’ (grant number 20140179) and by (ii) the Swedish Research Council (VR) in the project ‘Fundamental Studies on Molecular Interactions aimed at Preparative Separations and Biospecific Measurements’ (grant number 2015-04627).
[1] G, Guiochon, A. Tarafder, Fundamental challenges and opportunities for preparative supercritical fluid Chromatography, in Journal of Chromatography A 1218 (2011) 1037–1114.
[2] A. Tarafder, P. Vajda, G. Guiochon, Accurate on-line mass flow measurements in supercritical fluid chromatography, in Journal of Chromatography A 1320 (2013) 130–137.
[3] D. Åsberg, M. Enmark, J. Samuelsson, T. Fornstedt, Evaluation of co-solvent fraction, pressure and temperature effects in analytical and preparative supercritical fluid chromatography in Journal of Chromatography A, 1374 (2014) 254–260
[4] M. Enmark, P. Forssén, J. Samuelsson, T. Fornstedt, Determination of adsorption isotherms in supercritical fluid chromatography in Journal of Chromatography A (2013) 1312, 124-133 .
[5] M. Enmark, J. Samuelsson, E. Forss, P. Forssén, T. Fornstedt , Investigation of plateau methods for adsorption isotherm determination in supercritical fluid chromatography in Journal of Chromatography A. 1354 (2014) 129–138.
[6] M. Enmark, D. Åsberg, H. Leek, K. Öhlén, M. Klarqvist, J. Samuelsson, T. Fornstedt, Evaluation of scale-up from analytical to preparative supercritical fluid chromatography in Journal of Chromatography. A 1425 (2015) 280-286.
[7] J. Fairchild, J. Hill, P. Iraneta, Influence of sample influence of sample solvent composition for SFC Separations, in LC GC N. AM. 31:4 (2013) 326–333.
[8] D. Yun, G. Li, A. Rajendran, Peak distortions arising from large-volume injections in supercritical fluid chromatography, in Journal of Chromatography A 1392 (2015) 91–99.
[9] L Miller, I. Sebastian, Evaluation of injection conditions for preparative supercritical fluid chromatography. in Journal of Chromatography A 1250 (2012) 256-263.
[10] M. Enmark, D. Åsberg, A. Shalliker, J. Samuelsson, T. Fornstedt. A closer study of peak distortions in supercritical fluid chromatography as generated by the injection. In Journal of Chromatography A 1400 (2015) 131-139
[11] R.A. Shalliker, H.J. Catchpoole, G.R. Dennis, G. Guiochon, Visualising viscous fin-gering in chromatography columns: high viscosity solute plug, In Journal of Chromatography A 1142 (2007) 48–55.
[12] P. Vajda, G. Guiochon, Surface excess isotherms of organic solvent mixtures ina system made of liquid carbon dioxide and a silicagel surface, , In Journal of Chromatography A 1308 (2013) 139–143.
[13] E. Glenne, K. Öhlén, H. Leek, M. Klarqvist, J. Samuelsson, T, Fornstedt, A closer study of MeOH adsorption and its impact on solute retentions in supercritical fluid chromatography in Journal of Chromatography A, 1442 (2016) 129–139.
[14] T. Fornstedt, G. Guiochon, Comparison between Experimental and Theoretical Profiles of High Concentration Elution Bands and Large System Peaks in Nonlinear Chromatography, in Anal. Chem. 66 (1994) 2686–2693. doi:10.1021/ac00089a015.
[15] T. Fornstedt, P. Forssén, D. Westerlund, System peaks and their impact in liquid chromatography in TrAC Trends in Analytical Chemistry Juli Vol. 81 (2016) 42-50. DOI: 10.1016/j.trac.2016.01.008.
[16] T. Fornstedt et al at 16th International Symposium on Preparative and Industrial Chromatography and Allied Techniques, OC33 - Tuning of Peak Deformations, Due to Co-Solvent Adsorption, in Preparative Supercritical Fluid Chromatography.


-(1).jpg)