Mass spectrometry & spectroscopy
Published over 3 years ago. See the latest and most current information on Mass spectrometry & spectroscopy.
To determine whether a GC-MS system is suitable for the detection of analytes occurring in trace and ultra-trace levels, the calculation of the instrument detection limit should be used. Historically, signal-to-noise ratio (S/N) has been employed to convey the detection limit. However, advancements of MS technologies have resulted in reduction of noise and increased sensitivity. When combined with lower bleed GC columns producing sharper peaks, noise levels go to zero in certain time segments. This results in very high signal-to-noise numbers and does not give a true representation of the limit of detection (LOD). Therefore, a more accurate or statistically significant method of calculating the detection limit of an instrument is required.
To determine the instrument detection limit (IDL), the standard deviation of the response of an analyte of choice at a concentration close to the estimated detection limit is used. This approach gives much more reliable LOD values as it considers not only the signal intensity, but also the consistency of the response. Method detection limits (MDL) are firmly established with many regulatory bodies and can be defined in numerous ways.
According to the most recent U.S. Code of Federal Regulations [1], MDL is defined as: “the minimum concentration of a substance that can be measured and reported with 99% confidence that the analyte concentration is greater than zero and is determined from analysis of a sample in a given matrix containing the analyte.” This methodology can be seamlessly transferred when calculating IDL. Unlike MDL, the IDL uses solvent-based standards containing the test chemical at concentrations that give a consistent response over several repeat injections (e.g., %RSD <10). Therefore, the IDL is a statistically rigorous method that uses the precision of a measurement at low analyte levels and accurately reflects the true detection limit of an instrument, ultimately defining how sensitive an analytical system is. Simply, the IDL can be determined by using the following equation [2].
IDL = t × Amount × %RSD
Where, t = student t-value for one-tailed distribution:
for example, for n = 8 injections; t = 2.998
Amount = amount of analyte (on-column)
%RSD = relative standard deviation of the response
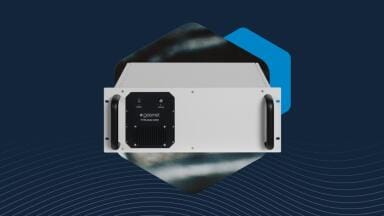
In this study, the IDL for octafluoronaphthalene (OFN), a commonly used reference compound in GC-MS systems, was determined using the Thermo Scientific™ ISQ™ 7610 single quadrupole GC-MS system with the Thermo Scientific™ ExtractaBrite™ source operating in EI mode. The ExtractaBrite source is an electron ionisation source with the filament positioned orthogonally with respect to the ion beam.
An ISQ 7610 system equipped with the ExtractaBrite ion source was coupled with a Thermo Scientific™ TRACE™ 1610 GC and a Thermo Scientific™ AS 1610 liquid autosampler was used for the assessment of the instrument detection limits. The IDL was derived using repeated injections (n=8) of OFN at 10 fg/μL. Instrumental conditions are detailed in Table 1.
Table 1. Experimental conditions for ISQ 7610 with Trace 1610 GC
The performance of the ISQ 7610 system was evaluated using sixteen replicate injections of a 10 fg/μL OFN standard in iso-octane. Stable peak area responses were observed with %RSD of <7% as reported in Figure 1. The minimum %RSD calculated using n=8 injections was 5.7, and it was used to derive the IDL that resulted = 1.7 fg on column. Figure 2 shows the overlaid chromatograms of the injections that were used to derive the IDL. To verify the IDL, a standard of OFN at 2 fg was injected. As demonstrated in Figure 3, shows the OFN peak was clearly detected at such low concentration with a peak-to-peak calculated S/N of 4:1.
Figure 1. Absolute peak area responses over 16 injections.
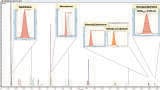
Figure 2. Overlaid chromatograms of eight consecutive injections of OFN at 10 fg on column showing a peak area %RSD=5.7. The calculated IDL is 1.7 fg.
The ISQ 7610 off-axis ion source, the unique s-shaped ion-guide, and the Thermo Scientific™ XLXR™ detector allowed for improved instrument performance. The off-axis ion source and unique s-shaped ion-guide creates a curved path, which allows chemical and neutral noise to be kept to a minimum, enabling lower detection limits. The XLXR detector provides the sensitivity to detect and amplify the low number of transmitted ions needed at this challenging analyte concentration.
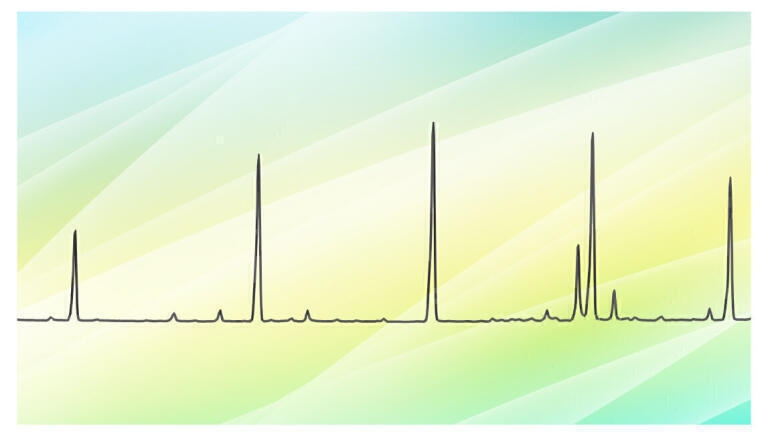
Figure 3. Chromatogram of 2 fg OFN on-column with a signal-to-noise ratio of 4 to 1.
The ISQ 7610 system with the ExtractaBrite ion source exhibits low instrument detection limits, ensuring confidence in trace analysis. The use of a statistical method to determine the IDL demonstrates the consistent and sensitive detection that can be achieved at this challenging analyte concentration. The detection limits using a 10 fg on-column amount have been shown to be highly reproducible. The exceptionally sensitive XLXR detector, complemented by the innovative s-shaped ion guide, effectively reduces noise while maintaining maximum sensitivity, leading to OFN IDLs significantly below 5 fg on column.
1. U.S. Code of Federal Regulations, 49 FR 43430, (Oct. 26, 1984); 50 FR 694, 696 (Jan. 4, 1985), as amended at 51 FR 23703 (June 30, 1986), http://www.ecfr.gov/cgi-bin/text-idx?SID=efe93db42854f88dffcf66ba8de737e6&mc=true&node=ap40.23.136_17.b&rgn=div9
2. International Union of Pure and Applied Chemists (IUPAC), http://media.iupac.org/publications/analytical_compendium/Cha18sec437.pdf
To request a technical note titled Determination of the instrument detection limit of the TSQ 9610 triple quadrupole GC-MS/MS with Advanced Electron Ionization (AEI) source, please contact: [email protected]
Find out more at thermofisher.com/ISQ7610