Mass spectrometry & spectroscopy
Published over 3 years ago. See the latest and most current information on Mass spectrometry & spectroscopy.
The aim of this application note is to demonstrate the wide dynamic range and the robustness of the Thermo Scientific™ ISQ™ 7610 single quadrupole mass spectrometer, using the new Thermo Scientific™ XLXR™ detector, coupled to a Thermo Scientific™ TRACE™ 1610 gas chromatograph, for the analysis of 19 polycyclic aromatic hydrocarbons (PAHs) in soil and water, according to the United States Environmental Protection Agency (EPA) Method 8270E.
Polycyclic aromatic hydrocarbons (PAHs) are organic compounds consisting of carbon and hydrogen atoms. Chemically the PAHs comprise two or more aromatic rings bonded in linear, cluster, or angular arrangements, resulting in a wide diversity of physical, chemical, and toxicological properties. PAHs are ubiquitous and can contaminate soil, air, sediments, and water and are resistant to environmental degradation. These compounds are found in fossil fuel sources and manmade chemicals and are derived from the incomplete combustion of organic matter used for human activities (such as vehicle emissions, rubber, plastics, and cigarettes). PAHs have toxic effects because of their chemical structure and act as a carcinogen or endocrine disrupter. Due to their toxicity, they are monitored in the environment with strict regulations [1].
One of the most common regulations followed for the analysis of PAHs is EPA Method 8270E [2]. Analytical laboratories following this method face several challenges. The first challenge is that isobaric compounds must have sufficient chromatographic resolution, in particular benzo[b]fluoranthene and benzo[k]fluoranthene. High boiling compounds, such as benzo[g,h,i]perylene, also pose a challenge as there is a possibility for carryover and peak broadening [3]. Careful optimisation of instrumental conditions must be done to avoid saturation and linearity loss; labs may also need to separate calibration curves for different matrices, for example soil and water, to ensure they do not exceed the linear dynamic range of the system.
Following the regulations for EPA Method 8270E comes with its own challenges. DFTPP tuning must be performed to ensure that the ion abundances are acceptable for the analysis. 8270E requires a tune during the initial full calibration, then the continuing calibration to be run every 12 hours after that for analysis. All previous versions of 8270 before E required a full DFTPP tune every 12 hours. If DFTPP tune fails, the entire of batch of samples must be rerun to be compliant with the method. The final challenge for analytical testing laboratories performing this analysis is to maintain the sample throughput. It is essential that the instrument performs consistently throughout the analysis, and extended runs without maintenance are desirable. If there is any unproductive time on the instrument caused by venting to clean the system or changing the column, the sampler turnaround time and asset utilisation is affected and results to clients are delayed.
In this application note, the ISQ 7610 single quadrupole GC-MS system was utilised for the simultaneous analysis of PAHs in water and soil samples. The XLXR detector comes as standard on the system and offers extended linear dynamic range and lifetime. For this analysis, a single calibration curve over five orders of magnitude was utilised to analyse water and soil samples. This extended dynamic range eliminates the need to run separate curves for different matrices and aids to increase sample throughput. An extended run of soil and water matrices were also analysed on the system to demonstrate the robustness for the analysis of PAHs. The NeverVent™ technology on the ISQ 7610 GC-MS also allows for instrument downtime to be significantly reduced due to the ability to exchange the column and clean the ionisation source without needing to vent the system. By eliminating unproductive time on the instrument, more injections can be performed on the system.
Native compounds calibration mix containing 18 PAHs listed in the EPA Method 8270 (each component at 2,000 μg/mL, P/N 31995), labelled internal standard mix (2,000 μg/mL, P/N 31206) and GC-MS Tuning mix (1,000 ng/mL, P/N 31615) were purchased from Restek; neat dibenzofuran (10 mg, P/N DRE-C20710000) was obtained from LGC and diluted in dichloromethane (DCM) to a concentration of 10 mg/mL. Surrogate standard mix (4,000 μg/mL, P/N M-8270-SS) was purchased from AccuStandards.
Preparation of solvent calibration curve, instrument detection limit (IDL), and method detection limit (MDL) samples
Thirteen calibration solutions in DCM, containing 19 native PAHs, labelled internal standards and the surrogate standard were prepared, ranging from 2.5 to 20,000 ng/mL (ppb) (full details in Appendix); the ISTD was at 1,000 ng/mL and the surrogate was at 800 ng/mL. Average response factor calibration was used, and 15% RSD criterion was applied to assess linearity in this wide calibration range. Instrument detection limit (IDL) was calculated by injecting a 2.5 ng/mL calibration solution in DCM. Method detection limit (MDL) was calculated using extracts of water and soil spiked at 2.5 and 5 ng/mL, respectively, after the extraction.
Water and soil extracts (n=76) were provided by PACE Analytical®, USA. Samples were spiked, extracted following the EPA Methods 3510 [4] and 3511 [5] for water, and EPA Method 3546 [6] for soil. Water and soil samples with low levels of PAHs were spiked to have QCs at low (0.01 ppm), middle (1 ppm), and high (10 ppm) level to check for method accuracy and robustness. All the samples were injected randomly and used to assess instrument robustness over n=150 matrix injections without inlet, column, mass spectrometer maintenance, or re-tuning.
Liquid injections of the sample extracts were performed using a Thermo Scientific™ TriPlus™ RSH SMART autosampler. Chromatographic separation was achieved using a Thermo Scientific™ TraceGOLD™ TG-PAH 30 m × 0.25 mm i.d. × 0.10 μm column. This column allowed compliance to EPA Method 8270 in terms of resolution, as well as excellent peak shape for all the compounds, including the ones with high boiling point, due to the film thickness and the high working temperature (up to 360˚C).
For the analysis, the ISQ 7610 single quadrupole GC-MS, coupled with a TRACE 1610 GC gas chromatograph and equipped with the ExtractaBrite™ ion source, was used. The method conditions are shown in Table 1. The system was operated in Selected Ion Monitoring (SIM) mode to monitor the PAHs, and in full scan (from 50 to 500 m/z, dwell time 0.20 s) for the tuning solution.
Table 1. GC-MS acquisition method parameters for the determination of 19 PAHs in water and soil samples.
A full list of analytes, as well as quantifier and qualifier ions that were monitored, is listed Table 2. The system was tuned with a built-in EPA Method 8270E specifically designed tune type.
Table 2. List of target PAH compounds, with their retention time and SIM quantification and confirmatory ions
Data were acquired, processed, and reported using Thermo Scientific™ Chromeleon™ 7.3 CDS software, which allows instrument control, method development, quantitative/qualitative analysis, and customisable reporting all within one platform. The GC-MS Environmental Extension Pack includes a suite of report templates, processing methods and eWorkflows™ to facilitate environmental analysis by GC-MS using EPA Methods 8270, 524, 525, and 8260 [6]. For the analysis of PAHs, monitoring the ratios between the masses of the DFTPP is required and automatically performed by the software System Suitability Check. Chromeleon CDS allows rapid implementation of the PAHs method into any analytical laboratory and ensures the system produces results shortly after installation.
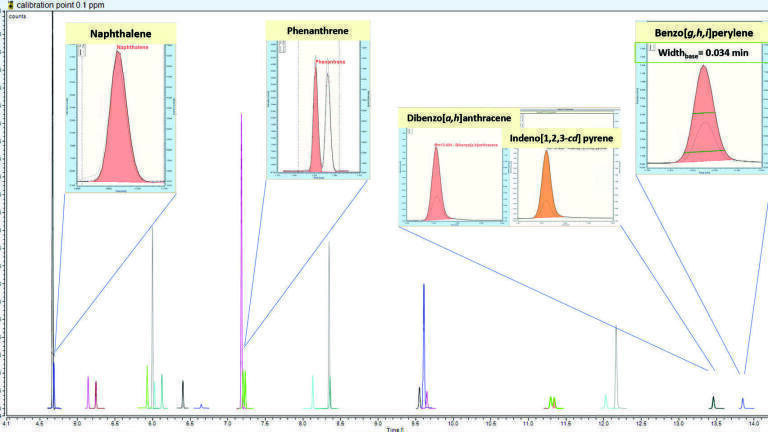
The optimised GC conditions and the high selectivity of the TraceGOLD TG-PAH capillary column allowed for chromatographic resolution of isobaric compounds in a total run time of 15.2 minutes, meeting the EPA Method 8270E requirements. Gaussian peak shapes were obtained for all the compounds, including the ones with high boiling points.
An example chromatogram obtained for a solvent standard at 0.1 ppm is shown in Figures 1 and 2. Peaks of naphthalene and benzo[g,h,i]pyrene, the first and the last eluting PAHs, show gaussian and sharp peak shape from the beginning to the end of the method; baseline peak width for benzo[g,h,i]pyrene was 0.034 min.
Phenanthrene and anthracene compounds are almost baseline resolved; benzo[b]fluoranthene and benzo[k]fluoranthene have a resolution of 20% (calculated as the ratio between the height of the valley and the smaller height of the apex of the two compounds); dibenzo[a,h]anthracene and indeno[1,2,3-cd]pyrene coelute and rely on mass separation.
A calibration curve ranging from 2.5 ng/mL to 20,000 ng/mL was prepared to assess linearity with the average relative response factor (AvRF) calibration fit type and the %RSD <15% criterion required in the EPA Method 8270E. Calculated %RSDs were <10% for all the compounds across the entire calibration range. The extended dynamic range of the XLXR detector allowed for using only one calibration curve rather than two different ones for the analysis of trace level and highly contaminated samples. Calculated AARF and %RSD results are reported in Table 3. Examples of calibration curves are shown in Figure 3.
Figure 2. Chromatographic separation of benzo[b]fluoranthene and benzo[k]fluoranthene. Peak resolution is calculated as the ratio between the height of the peak valley and the height of the peak apex of the smaller compound.
To determine the instrument detection limit (IDL) for each analyte, the response and its standard deviation were taken into account [8]. This approach gives much more reliable LOD values as it considers not only the signal intensity, but also the consistency of the response. IDLs were calculated by eight repeated injections of the 2.5 ng/mL calibration solution in DCM, using Equation 1 [8].
IDL = t(n–1,1–α=0.99) × mOC × %RSD (Equation 1)
Where:
t = Student t-value for one-tailed distribution at 99% confidence with 7 degrees of freedom (2.998)
mOC = mass of analyte on column
%RSD = %RSD of the response (peak area) over the 8 repeated injections. %RSD must be consistent (%RSD < 15%).
IDLs ranged from 0.3 to 0.97 pg on columns, as reported in Table 4.
The method detection limit (MDL) is defined as the minimum measured concentration of a substance that can be reported with 99% confidence that the measured concentration is distinguishable from method blank results [9]. For the calculation of MDL, blank extracts of water and soil were selected, pooled, and spiked at different levels (2.5 ng/mL and 5 ng/mL) after the extraction; eight repeated injections were made, and the calculations were done applying the formula reported in Equation 2.
MDLs = t(n-1,1–α=0.99) × Ss (Equation 2)
Where:
t = Student t-value for one-tailed distribution at 99% confidence with 7 degrees of freedom (2.998)
Ss = sample standard deviation of the calculated concentration
MDLs ranged from 0.44 to 6.94 pg on column for water, and from 0.48 to 7.60 pg on column for soil.
Table 4. Instrument detection limit in pg on column for the 19 native PAHs in DCM solvent
Repeatability was tested by n=10 consecutive injections of a 20 ng/mL QC in water and 20 ng/mL QC in soil. The QCs were prepared spiking blank matrices. Results are reported in Figure 4. Overall %RSD was <5.5% for water and <15% for soil matrix.
System robustness and suitability for high-throughput analysis was assessed for a total of n=136 samples and 52 hours of consecutive injections, without any GC and MS maintenance (liner change, column trimming, MS tune). Details on the batch are reported in Figure 5.
Tuning verification was performed after each series of samples, every 6 hours, injecting 1 μL of a tuning verification solution containing DFTPP at 20 μg/mL, acquired in full scan. Tune verification criteria reported in EPA Method 8270 were automatically verified by the system suitability test (SST) in Chromeleon CDS (Figure A1 in Appendix). At the end of the batch, tune verification was still passing the specifications.
Calibration check throughout the batch was done by injecting the calibration standards at different levels. The last two samples of the batch were the lowest (2.5 ng/mL) and the second to lowest (5 ng/mL) calibration points. (The accuracy in the back-calculation of these concentrations was still within ±10%.)
QCs for water and soil matrices, at three different levels (10, 1,000, and 10,000 ng/mL) were prepared and injected every 17 samples. Calculated concentrations were accurate and consistent over the batch and were ±20% of the amount spiked (Figures 6 and 7).
Figure 4. Peak area precision calculated in blank water and blank soil spiked at 20 ng/mL
Figure 5. Part of the batch used for robustness assessment. The batch contained 8 series of 17 samples each, namely 1 tuning mix, 1 calibration verification (CCV), 6 QCs (QC low, middle, and high for water and soil matrices) and 9 extracts of water and soil, randomly chosen. A total of n=136 samples were injected, for 52 hours of consecutive injections.
Figure 6. Calculated value of QC water blank matrix spiked at 10 ng/mL
Figure 7. Calculated value of QC soil, blank matrix spiked at 1,000 ng/mL. Calculated values are consistent and accurate (±15%) after 52 consecutive hours of injections and n=136 samples.
The results of the experiments described here demonstrate the ISQ 7610 GC-MS system meets and exceeds the EPA Method 8270E requirements for the analysis of PAHs in environmental samples.
• Gaussian peak shape and chromatographic resolution were achieved in compliance to EPA Method 8270E
• The XLXR detector demonstrated exceptional dynamic range, spanning over 4 orders of magnitude, from 2.5 ppb to 20 ppm for the 19 PAHs, with AvRF %RSD<10% for each compound, thus removing the need for the preparation of two different calibration curves and speeding up the analysis workflow
• IDLs and MDLs were in the low pg on column range, even for spiked matrices
• The system was shown to be robust, as performances were unchanged in terms of sensitivity, peak shape, and DFTPP tuning check, after 136 injections and 52 hours of continuous work
• The ISQ 7610 GC-MS system with NeverVent technology allows for ion source cleaning and column replacement without breaking the vacuum, thus ensuring minimal instrument downtime and high sample throughput. Unproductive instrument time is eliminated so more tests can be performed on the system
1. Lammel, G. Polycyclic Aromatic Compounds in the Atmosphere – A Review Identifying Research Needs. Polycyclic Aromatic Compounds 2015, 35, 316–329.
2. US EPA Method 8270E: Semivolatile Organic Compounds by Gas Chromatography/Mass Spectrometry, Revision 6, June 2018.
3. Thermo Scientific Application Note 10718: A fast, robust method for routine determination of polycyclic aromatic hydrocarbon (PAHs) in drinking water by single quadrupole GC-MS. Michela Balsamo et al. https://assets.thermofisher.com/TFS-Assets/CMD/Application-Notes/an-10718-gc-ms-pah-drinking-water-an10718-en.pdf
4. US EPA Method 3510: Separatory Funnel Liquid-Liquid Extraction, December 1996.
5. US EPA Method 3511 (SW-846): Organic Compounds in Water by Microextraction, Revision 1, 2014.
6. US EPA Method 3546: Microwave Extraction, February 2007.
7. Thermo Scientific Technical Note 10721: Routine, robust analysis of PAHs and PCBs in soil by single quadrupole GC-MS. Aaron Lamb et al. https://assets.thermofisher.com/TFS-Assets/CMD/Technical-Notes/tn-10721-gc-ms-pahs-pcbs-soil-tn10721-en.pdf
8. Thermo Scientific Technical Note 10499: Practical determination and validation of instrument detection limit of Thermo Fisher Scientific ISQ LT Single Quadrupole GC-MS. Richard Law, Tommaso Albertini. https://assets.thermofisher.com/TFS-Assets/CMD/Technical-Notes/tn-10494-single-quadrupole-gc-ms-tn10494-en.pdf
9. US EPA: Definition and Procedure for the Determination of the Method Detection Limit, Revision 2, December 2016.
Learn more at thermofisher.com
For the analysis of volatile organic compounds (VOCs) in water (AN-000305) or the analysis of VOCs in soil (AN-000377) using purge and trap coupled to single quadrupole GC-MS, please contact [email protected]