GC-MS
Published over 8 years ago. See the latest and most current information on GC-MS.
From time to time analysts in research or QC laboratories are faced with finding and identifying differences between a newly measured sample and a so-called reference sample. These questions may typically arise in application areas like product control analysis or during troubleshooting. Example questions are: is the fragrance composition of the most recent production batch equal to a reference batch, why does this product have a different smell compared to our reference product, or when comparing samples in food fraud applications to detect illegally added substances. Fast detection of minor components and reliable identification is critical in these situations. When using analytical techniques like GC/MS and GCxGC/MS, software tools specialised in differential or comparative analysis are nowadays available and can be used during routine analysis.
Comprehensive two-dimensional gas chromatography coupled with mass spectrometry (GCxGC/MS) is a very powerful analytical technique for the analysis of complex mixtures. The technique offers a tremendous increase in peak capacity compared to 1-dimensional GC and due to the orthogonal nature of the separation mechanisms in GCxGC, compounds are easily separated from matrix interferences. GCxGC/MS has been utilised for the analysis of many complex mixtures in complex matrices such as petroleum analysis [1], environmental analysis [2], forensics [3] and food products [4].
However, the large amount of data generated from comprehensive GCxGC/MS requires the use of computerised assistance for data processing and data mining and while there are many different software tools available, handling 2D chromatography data remains a challenging task in analytical chemistry. This is especially true in the field of comparative or differential analysis, where in batch comparison and troubleshooting applications it is imperative to quickly assess the differences, if any, between two measured samples within a limited timeframe. Furthermore, in most cases limited samples are available, excluding the use of multivariate data analysis tools as applied in metabolomics.
In the differential analysis regime used here, only two samples, a ‘Sample’ versus a ‘Target’ are compared. The ‘Target’ is considered to be the reference for a product of good quality. The ‘Sample’ can be the newly produced batch or a sample deviating in quality characteristics, such as for example smell, flavour, colour.
In metabolomics GCxGC applications, involving multiple samples, the alignment of time scales between all samples is often one of the major bottlenecks [5]. In the current approach both Sample and Target are measured directly, and so no alignment problems should occur, although it can be checked using a cross-correlation procedure between second dimension chromatograms. The cross correlation method will shift the second dimension chromatograms a number of modulation periods and calculates the optimal shift. If no alignment problems exist, a shift of zero modulations periods will be reported. In general, the direct measurement of sample and reference permits time alignment procedures to be skipped.
The actual comparison or differential analysis is based on ratio-analysis between all peak areas detected in the sample versus the target so no statistics or multivariate methods are required, which makes the differential approach easy to use by any analyst; even for a user with a weak background in statistics.
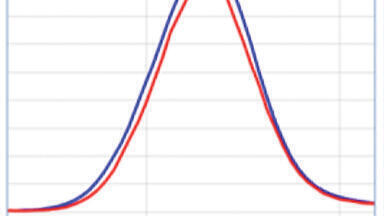
The concept of differential peaks is explained in more detail in Figure 1. The plot on the left shows an ion trace for the sample (blue) and the target (red). The area ratio between both peaks is 1.1, indicating very similar intensities. The middle plot shows a combination in which the sample is 4.1 times higher compared to the target. The plot on the right shows a unique peak, which is not present in the target. In this case the ratio value is 71.
Besides a ratio, the software will also calculate a so-called ‘Uniqueness’ value, which expresses if a peak is truly absent in the target. The uniqueness value ranges from -100 to 100 and is calculated as:
100*(A1-A2)/(A1+A2), in which
A1: area of sample peak
A2: area of target peak
If the uniqueness value is near zero it means similar peaks, while a value of 100 relates to a component present in the sample but totally absent in the target. Uniqueness values for the three examples A, B, and C are: 4.5, 61.0 and 97.2, respectively.
A reference fragrance sample, called ‘reference or target’, containing about 300-400 components was spiked with a second fragrance sample having similar but different composition (‘the sample’). GCxGC analysis was performed with an Agilent GC system equipped with Markes/Almsco Time of Flight DS mass spectrometer and Zoex GCxGC modulator.
The column set used consisted of a 25 m × 0.25 mm, 0.25 µm DB-1MS (Agilent) capillary column connected by a press fit connector to a 2 m × 0.1 mm, 0.1 µm DB-17 MS (Agilent). For all runs, the modulation period was set to 5.0 s. The oven temperature programme was: 50°C at 3°C/min up to 290°C.
In the second example two samples from coffee production were analysed. One of these samples had off-flavour characteristics and was analysed for differences compared to a regular coffee sample.
Peak detection, differential analysis and identification were all performed utilising automated detection tools in MsMetrix’s GCxGC-Analyzer™ software [6] on raw data imported directly from Agilent MassHunter data files.
Peak detection and differential analysis can be performed in two possible modes of operations 1) Total Ion Current (TIC) processing or 2) the so-called ‘All Ion Data’ processing. The first procedure only uses the TIC, which most of the time is more than adequate due to the high separation power of GCxGC. The ‘All Ion Data’ mode of operation involves peak detection using all available MS data, as in 1-dimensional GC/MS deconvolution and is more powerful allowing for the detection and deconvolution of overlapping peaks in GCxGC/MS; this method is typically employed for highly complex samples where the chance of co-elutions or near co-elutions increases with the number of sample components. In the All Ion Mode procedure, peak detection is performed on all individual fragment chromatograms, after which deconvolution is performed by grouping ions that have equal retention times and peak shapes. The all ion deconvolution allows for the detection of closely eluting components that would be missed in the TIC chromatogram.
Default settings were used in the data analysis, which includes a ratio threshold of 3.0 for differential analysis. Deconvoluted spectra of differential components were submitted to NIST MS Search software for identification.
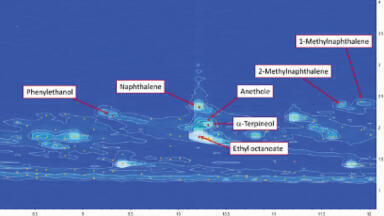
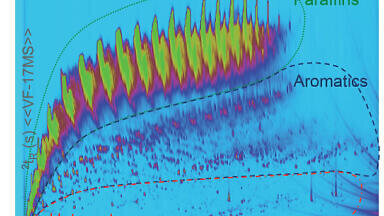
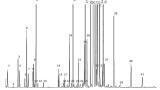
Figure 2 displays the GCxGC HeatMaps in logarithmic scale for the fragrance reference target and the sample (left) containing the additional spiked components. Visual comparison is possible, but will be a time-consuming task, especially for very small peaks which are generally difficult to distinguish based on colour alone.
A direct total analysis run on the sample detects 762 components and includes many stationary phase bleed substances in the lower right corner. However, when a differential analysis is performed, only components will be reported that are really different based on the peak area ratios between sample and target peaks. All matching peaks that are similar, including those from bleed, will be automatically removed. The differential analysis detected 45 components, marked with red symbols, in less than 10 seconds all of which had area ratios between sample and target peaks larger than 3. The deconvoluted MS spectra are subsequently submitted to NIST search and returned hits have typical matching scores higher than 800. In addition to the ratio calculation, a so-called ‘Uniqueness’ criterion will be calculated, which expresses if a component is truly absent in the target.
A different type of view is shown in Figure 3. The 3-dimensional plots for both the sample and target are shown and differential peaks are marked in the left plot.
When using the ‘All Ion Data’ data processing mode for differential analysis, a number of extra components were detected but not found using the above ‘TIC’ procedure. One of these components is shown in the heatmap in Figure 4 and marked with a green + symbol. From the heatmaps it appears that both peaks are very similar however the ‘All Ion’ approach detects a differential peak inside the upper peak in the heatmap. One of the most characteristic ions for this component is m/z 132 and the ion traces for sample (blue) and target (red) are shown plotted below the heatmaps in Figure 4.
From the TIC’s displayed in Figure 5, a small shoulder on the left side of the second sample peak is observed, but not detected in the TIC processing mode. The ‘All ion’ procedure is much more selective and will detect the co-eluting differential peak. Even in the case of perfect peak overlap it is possible to find and identify co-eluting components using the All Ion approach.
For identification, only ‘differential ions’ will be used to reconstruct the estimated GC/MS spectrum. This unique feature of the algorithm permits the correct identification of minor differential peaks, even in the case of total peak overlap or co-elution under large peaks.
Differential analysis is also a powerful tool in situations where a product deviates from expected characteristics and needs to be compared to reference samples.
The example below features an off-flavour coffee sample.
Figure 6 shows the GCxGC heatmaps for
the two coffee samples, with the map on
the left relating to the off-flavour sample and the one on the right being the reference. More than 2000 components are present in this sample.
In comparison to the previous fragrance example, where the search was applied to up-regulated components only, this case of differential analysis is run for both up-regulated and down-regulated components. A total of 38 differential components were detected having a ratio larger than 3 (up-regulated) or smaller then 0.33 (down-regulated). Calculation time was less than a minute. After identification, researchers use the results for interpretation and root-cause analysis.
The comparison of highly complex samples measured with GC/MS or GCxGC-TOF-MS systems can be a difficult and time consuming task. It has been demonstrated in the two cases covered in this work that differential analysis algorithms are powerful tools to find differences between two samples. The untargeted analysis is simple to perform and does not require statistical skills or tools, allowing the analysis and data mining to be performed by the same analyst.
For more detailed information please visit our website at www.msmetrix.com, or contact us at [email protected].
Special thanks to Clara van der Kroft and Lukas Breimer, Applications Scientists at MsMetrix, for their contributions in this work.
1. J. R. Radović, K. V. Thomas, H. Parastar, S. Díez, R. Tauler and J. M.Bayona, Environ. Sci. Technol., 48(5), (2014), 3074
2. P. Haglund, Analytical and Bioanalytical Chemistry, 30(7), (2008 ), 1815
3. J. Dekeirsschieter, P. Stefanuto, C.Brasseur, E. Haubruge, J. Focant, Plos one, 18, (2012), http://dx.doi.org/10.137
4. P.A. Tranchida, P. Donato, F. Cacciola, M. Beccaria, P. Dugo, and L. Mondello, TRAC, Trends Anal. Chem., 52, (2013). 186–205.
5. J. Jeong, X. Zhang, X. Shi, S.Kim, BMC Bioinformatics (2013), DOI: 10.1186/1471-2105-14-123
6. L. Breimer, Differential Analysis applied to GC/MS and Comprehensive GCxGC/MS, Application Note, MsX-300-12, MsMetrix BV.