
GC, MDGC
Published over 12 years ago. See the latest and most current information on GC, MDGC.
Gas Chromatography has been a front line analytical technique for several decades and is routinely used for environmental, pharmaceutical, and food sample analysis [1-3]. Although there has been a gradual move to perform the analysis of more polar compounds using HPLC, there is still a substantial amount of analysis being performed using this technique.
The technology has changed substantially since the early systems such as the Pye 104, Figure 1, with the introduction of constant pressure and constant flow systems, improved injector designs, capillary columns and more inert stationary phases. The developments have meant a substantial improvement in the performance of the chromatographic separation process, but also highlight the need to understand the technology before it can be effectively employed.
This article will deal with column selection, both in terms of stationary phase and also in terms of the physical dimensions and how a user can move to faster chromatography by using narrower i.d. and shorter columns. As the diameter of the column is reduced so the efficiency of the chromatographic separation can be improved. This allows the separation scientist either to use the enhanced efficiency to drive better resolution or to offset the improved efficiency against the elution time. There are limitations with this approach but these will be discussed in detail in subsequent sections.
Phase selection
The primary goal of developing a chromatographic separation is to resolve a mixture of analytes. From the general resolution equation (Equation 1) it is evident there are three parameters that control resolution, namely efficiency (N), selectivity (α) and the retention (k’) factor. Selectivity and retention factor can be improved by changing the column chemistry, carrier gas linear velocity and temperature ramp rate. The selectivity relates to the separation of two components and this is the most impactful variable on resolution.
Equation 1
Unlike with liquid chromatography, there are a limited number of phases that are available to the gas chromatographer to enable resolution of the analytes under investigation. In particular for capillary columns the following are the most commonly used type of phases.
• Squalene 100% dimethyl polysiloxane
• 5% phenyl
• 35% phenyl
• 50% phenyl
• 6% cyanopropyl
• 14% cyanopropyl
• 50% cyanopropyl
• (WAX) PEG
• FFAP (modified PEG)
The most popular of these phases are the 100% dimethyl polysiloxane, 5% phenyl and the WAX columns. The manufacturing process for capillary columns has been well established, although it should be noted that the degrees of thermally driven column bleed and also the activity of the columns towards certain basic compounds can and does vary between different manufacturers. Overall the retention mechanisms for similar columns are comparable; this is in contrast to the observation with HPLC manufacturers where it is very evident that all C18 phases are not the same [4]. Thus in GC method development, approaches tend to be based on the type of assay with well defined column chemistries being utilised for specific separations. It should be noted though that a GC separation is not just based on boiling point, which is an over simplification of the stationary phase interactions and that some understanding of the interactions of the stationary phase can aid method development.
It is generally considered that there are three different mechanisms of retention when using GC [5], and that utilisation of different columns will alter the degree of retention of each of these three primary mechanisms. These three modes are;
• dispersive interactions
• dipole-dipole
• hydrogen bonding
In order to demonstrate the three different modes of interaction with a GC column a series of test probes were injected onto a range of columns. The probes were chosen to reflect the different interactions that are possible with the various columns.
Changing the stationary phase will alter the degree of interaction with each of these modes of retention, and as a consequence will affect the selectivity.
Figure 2 demonstrate the effect of the different modes of interaction on a set of test probes. In this scenario altering the polarity of the columns results in a different degree of selectivity for a series of test compounds, which have been chosen to highlight particular modes of interaction. It can be seen that increasing the polarity of the stationary phase results in alterations in the selectivity of the separation. It is interesting to note that the 100% dimethylpolysiloxane column, which is often quoted as a boiling point column, relies more on retention time discrimination based on dispersive forces rather than boiling point. London dispersion forces, named after the German-American physicist Fritz London, are weak intermolecular forces that arise from the creation of momentary dipoles, with larger, more linear molecules in general being able to maintain the dipole better than smaller molecules, and hence have a greater dispersive interaction [6].
Increasing the amount of phenyl present in the stationary phase increases the degree of hydrogen bonding that is available and reduces the degree of dispersive interactions. Thus in general although there is less retention for the majority of the test probes, the compounds which have the ability to hydrogen bond (1-heptanol and phenol) experience a relative increase in retention time, compared to the other compounds.
Finally, with the PEG column it can be seen that the dominant mode of retention is a combination of hydrogen bonding and dipole-dipole interaction. It can be seen, with this column, that the 1-heptanol and phenol both exhibit an increase in the retention time. However, dispersive forces are also still present as may be observed by the retention of some of the more neutral compounds.
Deterministic relationship with retention time / gradient
An understanding of the column stationary phase will substantially aid the development of a suitable mode of interaction between the analytes which in turn will drive the separation. However, the optimisation of the stationary phase is really only ideal for a small number of analytes, and in general focusing on the efficiency term in Equation 1 will provide solutions that are applicable to a wider range of compounds. In GC this can be achieved by a reduction in the film thickness, column diameter (both of which reduce the dispersion of the peak due to diffusion) or an increase in the column length (which increases the efficiency proportional to the length), and the next section will focus on these parameters. In particular, a method transfer calculation will be investigated that allows the determination of the system parameters required to optimise the transfer of a method to a narrower i.d. column which can result in a substantial reduction in analysis time.
The following equations (Equation 2) were used to determine the system parameters required to optimise performance using a Fast GC column, with the subsequent sections demonstrating the effects of varying some of the parameters listed in Equation 2.
Equation 2
Where;
tg1, tg2 - temperature gradient for original and new conditions
ν1, ν2 - linear velocity of gas for original and new conditions
T1, T2 - Hold time for isothermal part of separation for original and new conditions
β1, β2 - Phase ratio for original and new conditions
l1, l2 - length of column for original and new conditions
The use of narrow i.d. and thin film columns, coupled with very fast temperature gradients, is often referred to as Fast GC [7]. Significant improvements in the assay performance can be achieved without the need to make changes to the system set-up using a Fast GC column (20 m × 0.15 mm × 0.15 µm) compared to conventional column dimensions (30 m × 0.25 mm × 0.25 µm). The improved peak efficiencies obtained using a Fast GC column, without compromise in peak resolution, can be obtained provided:
• The ratio of column length to i.d. remains the same
• The column stationary phase should not alter
• The column phase ratio (β) is consistent between the two columns.
Further improvements in productivity can be obtained by combining higher optimal linear velocity, with an increase in the temperature ramp rate.
Figure 3 illustrates that by reducing the column diameter; efficiency increases and as a consequence so does the resolution. The efficiency is always greater in the narrower bore column, thus shorter columns can be used to reduce analysis time, whilst offsetting the reduced efficiency arising from shorter column length. Table 2
shows normalised efficiency for column length and diameter.
Another advantage of using a narrow bore column is that optimal linear velocity of carrier gas also increases, which allows shorter analysis time. From the Golay plots, shown in Figure 3, the optimal linear velocity that provides the highest efficiency is 32.7 cm/s for the narrower column compared to 28.5 cm/s for the conventional GC column. There are, however, some practical considerations with the use of narrow bore columns, including lower sample loading capacity which means that higher split ratios or reduced sample injection may be required to prevent column overload.
The Golay plot [8] is obtained under isothermal conditions and in reality the majority of GC analysis is performed using a temperature gradient. Using a phenol mixture the effect of varying the linear velocity (u, cm/s) of the carrier gas, when there is a temperature gradient being employed, can be seen in Figure 5. Increasing the linear velocity, increases the resolution and simultaneously reduces the analysis time. Under isothermal conditions, if the linear velocity deviates from the optimum linear velocity (uopt), relative peak broadening and loss of resolution is observed. At linear velocities above the optimum flow, chromatographic efficiency decreases due to a non-equilibrium of the solute between the stationary and carrier gas. Although, the efficiency drops, the absolute peak width will reduce because of the increase in the linear velocity driving the peak off the column in a reduced time.
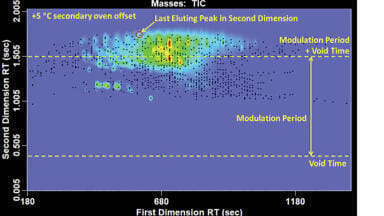
The effect of the increased carrier gas flow on the temperature gradient is to effectively decrease the temperature gradient relative to the time the compounds stay on the column. This is seen in Figure 4, where the peak capacity increases. The increased flow rate results in an increase in the peak capacity, due to the peak widths getting narrower and the temperature gradient effectively being decreased.
Keeping the phase ratio consistent
If the phase ratio (Equation 3) is kept consistent, then the elution order of compounds will be the same. Table 3 shows that a 0.25 mm x 0.25 µm GC column has the same phase ratio as a 0.15 mm x 0.15 µm column, so will show the same elution order of compounds. However, the efficiency on the 0.15 mm column diameter is greater, allowing for a similar separation to be performed with a shorter column length
Equation 3
β – Phase ratio of the column
dc – Column diameter (µm)
df – Film thickness (µm)
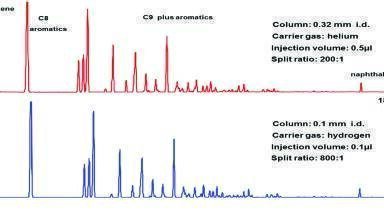
The separation of eleven compounds on a Thermo Scientific TraceGOLD TG-5MS GC column, under gradient temperature program is demonstrated in Figure 5. By reducing the film thickness from 0.50 µm to 0.25 µm, and using the same chromatographic conditions, the speed of analysis increases by 13%. The resolution of the critical pairs also increases for these semi-volatile components as a result of increased efficiency. The improvement in resolution is because there are less mass transfer effects occurring due to the reduced diffusional path in the stationary phase.
The effect that altering individual parameters can have on the improvement to the separation was previously discussed. To demonstrate this, a method scaling approach for a fatty acid methyl ester separation is presented, transferring the original method from a conventional column to a Fast GC column using theory outlined in Equation 2.
Three methods were used to analyse the test analytes, with each method employing the same phase ratio and column chemistry. The parameters varied were column length, column diameter, phase thickness, temperature heating rate and the linear velocity of the carrier gas. It can be observed that as the diameter of the column is reduced it is possible to perform the separation using a higher carrier gas linear velocity. Also there is a change in the temperature gradient, with the most significant difference between the methods being the total analysis time, which in the original GC method was nearly 20 minutes. This was reduced by nearly half by the modifications performed with no loss in resolution.
Conclusions
Understanding that GC columns do not separate solely by boiling point will greatly help in ensuring that the correct column is chosen for the analysis of a series of compounds. We have demonstrated that there are three fundamental modes of interaction that are available to GC chromatographers and that different columns have a different selectivity as a consequence of this. GC analysis time can also be significantly reduced by transferring a method to Fast GC columns. Performance is not compromised if the following are carefully considered:
• Column length
• Column i.d.
• Column film thickness
• Carrier gas linear velocity
• Temperature ramp rate
This approach has been used to transfer a FAMEs C8 – C24 mix from a standard 30 m x 0.25 mm x 0.25 µm GC column to a Fast GC column giving up to 50% faster analysis time, with no compromise in resolution and with no changes to system configuration.
References
1. F.J. Santos, M.T. Galceran, J. Chrom. A, Volume 1000 (2003) 125-151
2. C. Witschi, E. Doelker, European Journal of Pharmaceutics and Biopharmaceutics, 43 (1997) 215-242
3. K. Zhang, J. W. Wong, D.G. Hayward, P. Yang, Comprehensive Analytical Chemistry, 61 (2013) 55-95
4. K. Kimata, K. Iwaguchi, S. Onishi, K. Jinno, R. Eksteen, K. Hosoya, M. Araki and N. Tanaka, J. Chromatogr. Sci., Vol. 27 (1989) 721.
5. R.L. Grob, E.F. Barry (2004). Modern Practice of Gas Chromatography (4th Ed.). John Wiley & Sons
6. R. Eisenschitz, F. London, Z. Physik 60 (1930) 491–527
7. E. Matisová, M. Dömötörová, J. Chrom. A, 1000 (2003) 199-221
8. A.A. Clifford, J. Chrom. A, 471 (1989) 61-69


-(1).jpg)