Help Desk
Published over 12 years ago. See the latest and most current information on Help Desk.
Additionally some common challenges in the running of a bioanalytical assay will be discussed, and in particular how the introduction of the LC-MS can sometimes complicate the analytical process.
The problem at the onset was that the PK (pharmacokinetic) profile obtained for an IV (intravenous) trace had a Cmax, that is a maximum observed concentration, at two hours after the initial injection. In essence what this means is that it takes two hours for the compound to distribute itself around the body’s blood supply. Typically this should happen in less than two minutes. Clearly then something was not right. The company initially checked a variety of possible issues. Were the samples labelled correctly? Was the MS working? Finally it was decided to rerun the whole experiment and new patients were sought. This was very expensive and only served to provide the same answer as was obtained previously.
To understand what was happening, a better understanding is required of the actual challenge faced by bioanalysts. Many bioanalytical laboratories will routinely look for a limited number of samples, so for a PK/TK laboratory this may be just two or three compounds that are being monitored, whereas a hospital looking at clinical samples may be monitoring several tens of compounds. However this number does not necessarily reflect the number of compounds that are actually within the original sample [1]. In particular, in laboratories where a dilute and shoot approach, where the sample is merely diluted with water prior to injection, is employed (popular where cost per sample becomes a critical factor and where the sensitivity of the mass spectrometer is used to overcome some of the challenges associated with sample preparation), the number of compounds being chromatographed will be in the thousands. The reason for this phenomena lies in the detector that is commonly employed within this field.
Mass spectrometers are sensitive and selective pieces of instrumentation capable of detecting femto grams of material. One of the great advantages of this technique is that it can be tuned to effectively only see one compound, and effectively blinded to any other compounds that may be present in the sample. However, this is not exactly what happens in reality, since co-eluting components can interfere with the ionisation process resulting in substantial discrepancies being observed in the detector response for samples with nominally the same concentration [2,3]. This is often overcome by the use of an internal standard; ideally this will be an isotopically labelled version of the compound under investigation, which is used to compensate for any handling or ionisation variations between samples. This approach is commonplace within all bioanalytical laboratories and data is often presented as the area ratio of the compound and the internal standard. The assumption is that whatever affects the compound will also affect the internal standard to the same extent. However, on closer investigation, this statement is clearly not correct when large differences in concentration are being considered, since the degree of matrix effect will be a percentage of the actual concentration. If it is assumed that the effect that the dosing vehicle / matrix has on the compound and the internal standard is equivalent, then each must suffer a percentage change in the absolute response. Thus, for high concentrations the absolute amount of suppression can be quite large, whereas for low concentrations there is not an appreciable difference in the observed and actual concentrations from an absolute perspective.
The regulatory authorities are becoming more aware of this situation. Recent discussions at the Crystal City V meeting held in December 2012 in Baltimore, USA, on the ‘Quantitative bioanalytical methods validation and implementation: The 2013 revised FDA guidelines’ [4], have resulted in the issuing of draft consultative guidance notes which are moving towards a quality by design approach. In particular it is suggested that the internal standard response is monitored for drift and that an SOP should be developed a priori to address issues related to the variability in the internal standard.
This raises a few questions regarding the use of an internal standard and in particular how robust the internal standard is for the assay. It is generally assumed that for isotopically labelled internal standards that the variation on response that is seen matches that observed with the compound. As a consequence the amount of ion suppression observed is not important since the internal standard will compensate for this. In many scenarios this is true. However it is important to reiterate that there are examples where the internal standard will not compensate correctly for matrix interfering with the detector response, in particular where there are large variations in the concentration of the compound being analysed.
One such example can occur when the dosing vehicle is being used with the administered drug. Dosing vehicles are commonly used within the drug industry to aid the solubility of the drug into the blood stream. Examples of some commonly used dosing vehicles include Tween80, PEG, beta cyclodextrin, and Solutol 15. Typically a dosing vehicle is a polymer with a wide range of molecular masses, and will be incorporated into the test mixture at percentage levels, so will be present in the resulting blood/plasma sample from the patient. The nature of the polymer means that it is very likely to interfere with the ionisation process of the compound, directly through charge competition or indirectly by stabilising the solvent droplets [5]. In general, the dosing vehicle will have a different elimination rate from a patient to that observed for the compound of interest and as a consequence the amount of matrix interference from the dosing vehicle will vary as a function of time. One of the other challenges associated with the use of dosing vehicles is that because they are polymeric in nature there is a tendency for a range of compounds to be present within the dosing vehicle rather than just a single entity. This means that it is quite common for the dosing vehicle to exhibit poor chromatography, with very broad peaks that cover a significant part of the chromatogram being common. However since the selective nature of the mass spectrometer does not see the dosing vehicle in general it is not considered an issue. However, this poor chromatography can result in the dosing vehicle co-eluting with the analyte. If there is a degree of matrix interference caused by this co-elution then the amount of interference will vary as a function of the sampling time.
This was exactly what presented the originators of the problem discussed initially above. They were using a protein precipitation method for the analysis of a compound in a human trial. The protein precipitation did not remove the dosing vehicle which had not been present in the pre-clinical studies and the it was not considered the effect that the dosing vehicle would have on the assay. The protein precipitation had worked well with the pre-clinical trials, but the introduction of the dosing vehicle meant that the sample preparation had to be revisited.
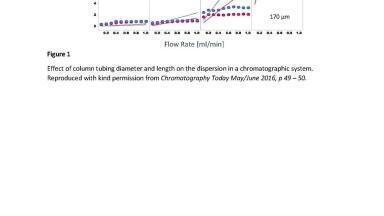
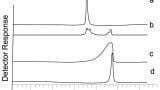
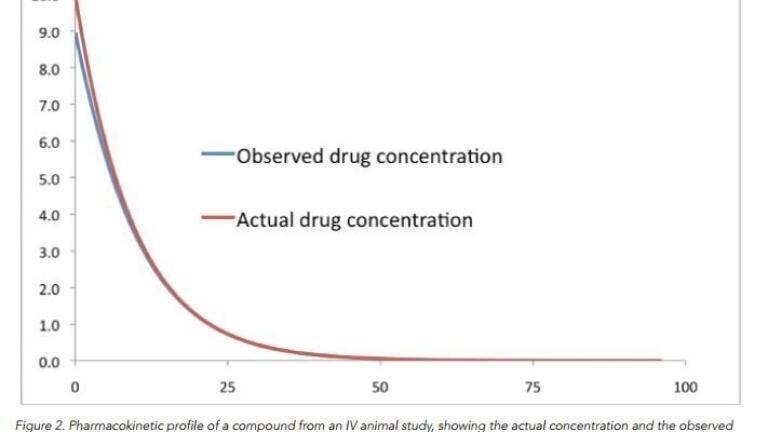
It is fairly easy to model this effect within an Excel spreadsheet. The results obtained from doing so can be quite startling. It is demonstrated in Figure 1 demonstrates what happens when there is a large amount of suppression caused by the dosing vehicle, whereas in the situation shown in Figure 2 the amount of ion suppression is substantially less. In Figure 1 the PK profile is very different from what is actually happening; indeed this profile better matches an oral introduction of the drug into the patient, where the drug takes time to get into the blood stream via the stomach.
The use of an internal standard does not help in this situation since the amount of matrix effects is dependent on the amount of dosing vehicle in the sample, which will vary from one sample to another, Figure 3. If the suppression was consistent (i.e. there was a constant amount of dosing vehicle), then the internal standard would be able to better compensate for the variation. However it is not - since the amount of compound causing the suppression effect varies from one injection to the next. This does raise another significant issue. Where the amount of suppression varies according to the matrix composition, monitoring the internal standard response would potentially highlight any issues with the assay. Looking at the internal response for methods where the sample preparation is not very rigorous then a large degree of variability can exist. An example of this is shown in Figure 4 which features the recovery of the internal standard using a protein precipitation method and using a solid phase extraction method. This can often happen when monitoring the drug concentration with ill patients whose matrix can vary considerably. Potentially, this suggests that data being produced in such circumstances could be somewhat suspect.
In the problem presented at the start of this dialogue, the solution was to improve the extraction methodology. A solid phase extraction method was employed which allowed for the selective removal of the dosing vehicle, which resulted in less variation on the degree of suppression. Ultimately this resulted in Cmax being observed with the first sample point taken after five minutes and so the PK profile matched the expected data produced from the pre-clinical studies.
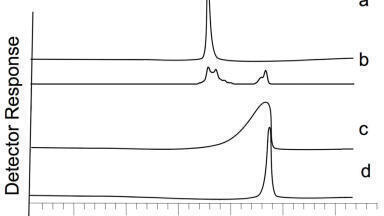
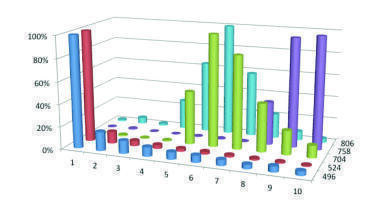
Information on the amount of suppression that can be caused by the addition of dosing vehicles has been reported previously [6]. If a dosing vehicle and the analyte are co-eluting into the mass spectrometer then ion suppression does occur (Figure 4). In the data produced for Figure 4, the analyte and the dosing vehicle were infused simultaneously into the mass spectrometer, which is what would occur if the chromatographic conditions did not result in a separation of the dosing vehicle from the analyte. The amount of ion suppression, or indeed enhancement as was observed with warfarin, varies dependent on the combination of dosing vehicle and analyte, and although not presented in this study also the concentration of each constituent.