Help Desk
Published over 5 years ago. See the latest and most current information on Help Desk.
There are typically two questions that a separation scientist will be asked.
What compounds are in my sample?
How much of those compounds are in my sample?
Liquid chromatography can help with answering both of these questions, although it should be noted that strictly speaking chromatography is blind [1] and that to be able to answer these questions a suitable detector is required. Ideally, the detector will be able to determine/confirm the identity of the compound and quantify the amount of compound present. A variety of detectors are available in liquid chromatography, each having advantages and sometimes disadvantages, with financial considerations often a major factor in the acquisition decision-making process. Therefore, although it might be argued that mass spectrometry is a better detection technique in terms of quantification and identification, it is not the most populous detection system due to financial considerations.
The demands placed on separation scientists to answer these two fundamental questions are becoming increasingly more challenging, and as a consequence, liquid chromatography has seen continuous developments. One of these developments addresses the need for a greater understanding of complex samples, by using two or higher dimension liquid chromatography. The theory behind this is well understood and has been the subject of previous Chromatography Today articles [2], and in essence, states that if two modes of chromatography are different then it is feasible to improve the resolution up to a maximum of the square of that obtained using a single dimension. The practicalities of liquid chromatography mean that in reality this is not achieved, however, significant improvements have been shown to occur when coupling columns that are orthogonal.
One of the challenges associated with the use of 2D LC is transferring the sample from the first-dimension column to the second-dimension column, and the Help Desk will focus on this in the present article. Interestingly many of the challenges, which are not always identified, also exist in one-dimensional chromatography and are associated with the injection of the sample into the mobile phase.
In transferring between the first and second dimension, as has previously been stated, it is preferred to use an orthogonal separation mechanism, which presents the challenge of ensuring that the transfer solute is compatible with the mobile phase in the second dimension. There are typically two aspects that can occur and relate to either a solubility/mixing issue or the solute plug being transferred in a strong eluotropic mobile phase.
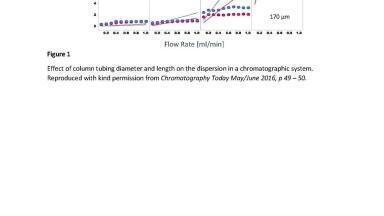
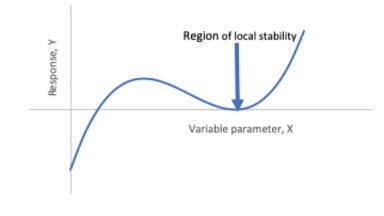
Figure 1 demonstrates what can happen if there is a solubility issue during the injection. It can be seen that in the example shown that the transfer solute is kept the same and that the mobile phase is altered, in this case from acetonitrile to methanol. It can be seen that the detector response for the system using acetonitrile resulted in a non-linear response curve and that obtained for methanol resulted in a linear response. If only the initial data was taken, it may have been assumed that the detector had gone outside of its linearity range, and the Help Desk suggests that this may be occurring in one or two examples in a one-dimensional system and that solubility has not been a consideration. The same observation can also be seen if the transfer solvent is not fully miscible with the second-dimension mobile phase.
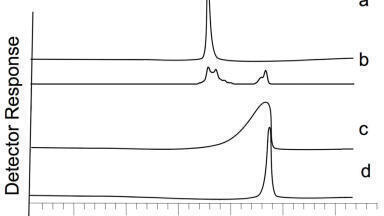
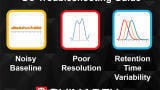
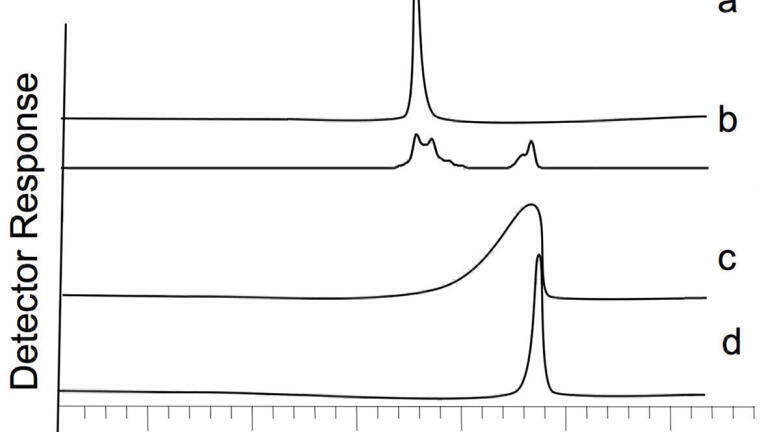
The other scenario that can occur is when the eluotropic strength of the transfer solvent is too strong and this results in the premature early elution of weakly retained analytes, Figure 2. It is also possible that the peak shape may become distorted as the analyte peak effectively starts to surf on the transfer solvent plug. Some examples of the different observed peak shapes are also shown in Figure 2.
Figure 2 shows a range of different observed peaks obtained for weakly retained (on the second dimension LC column) compounds. In one scenario the analyte peak can be seen effectively eluting with the transfer solvent. In another scenario, the analyte peak is split between components that are eluting with the transfer solvent elution time and the retention time that would be expected to be seen if there were no adverse effects from the transfer solvent. The final figure in this series shows a fronting peak. It should be noted that all of these observations can also be seen in one-dimensional chromatography and that the volume of solvent, physiochemical properties of the analyte used in the transfer can also affect the outcome.
The two scenarios that have been explained in the previous sections are however part of a more general phenomenon associated with how solvents mix. There are some excellent reference works in this field that explains and visualises the mixing process as well as a better understanding of the fluidic motion within a packed bed. [3] [4] [5]
The science of mixing has been extensively studied, and this has resulted in the generation of some very detailed models of fluid flow and how liquids mix. [6] [7] [8] [9] In the case of an injection plug this will describe how the injection plug disperses within the mobile phase. When the injection solvent is the same as the mobile phase the mixing with the mobile phase will not affect the retention of the analytes, however, when the injection solvent is different; the dispersion of the injection solvent, or transfer solvent when considering 2D HPLC, can become very important. The degree of mixing will depend on the nature of the flow, whether the flow is laminar or turbulent. In general, the fluid flow within a typical LC will be flowing under laminar conditions, although it is relatively trivial to determine what the fluid characteristics are by using the Reynolds equation [10], which is a measure of the inertial to viscous forces present within the fluid.
Re = μ0 l
where;
l – is a characteristic length scale, which for an open tubular system is the diameter of the pipe.
μ0 – is the mean linear velocity of the fluid through the column or the superficial velocity.
η – is the dynamic viscosity of the mobile phase.
It is generally accepted that Re below 10 is laminar and above 2000 the flow is fully developed turbulence. For most HPLC systems the flow
will not be fully turbulent, assuming viscosity of water, a flow rate of 1 mL/min and using 5/1000” tubing. It should be noted that the flow within the column uses a different characteristic length scale, which is related to the size of the channels between particles, and in this case enhanced mixing has been observed [11], suggesting that the flow is inertially dominated as opposed to dominated by viscous forces.
Where the flow is predominantly laminar complex morphologies can be created at the interface between the sample plug and the mobile phase. These structures are referred to as viscous fingers. Viscous fingering also referred to as a Saffman–Taylor instability is the formation of patterns, that look like fingers, in an unstable interface between two fluids in a porous medium, described mathematically [12]. It occurs at the interface between two different fluids percolating through a porous bed when the low-viscosity fluid pushes the high-viscosity fluid. In a chromatographic system, these two fluids are the mobile phase and a sample plug. If a high viscosity fluid is displacing a low viscosity fluid then the leading interface remains sharp, however, the trailing interface will exhibit a complex pattern resembling fingers. This phenomenon has been observed in preparative size-exclusion chromatography [13] resulting in severely distorted bands and, in a worst-case scenario, multiple bands are eluted when a single solute component was injected. Viscous fingering is unlikely to occur in analytical separations as the injection bands are too small, the concentration too dilute, and the viscosity tends to be very similar or the same as the mobile phase. For preparative chromatography and for transferring in 2D HPLC this is not always the case.
It is should be noted that fingering can occur even in the absence of a porous medium. If a low-viscosity fluid is injected into a sample loop containing a high-viscosity fluid, the low-viscosity fluid will begin to form fingers as it moves through the fluid, producing fractal structures. [14] [15]
Mayfield [13] investigated a series of different solvents, to simulate the effects that would be observed performing a heart cut between the first and second dimensions. Using a series of test probes, p-cresol, methoxybenzene, and ethoxybenzene, and a series of different mobile phases/injection solvents comprising of different mixtures of water/acetonitrile and methanol; the researchers demonstrated that significant amounts of distortion could occur because of ineffective mixing due to the formation of viscous fingers. The team went on further to show the morphology of the viscous fingers that were being generated within the chromatographic system. This was achieved using a mixture of dichloromethane, toluene and cyclohexanol which in the correct proportions has the exact refractive index as the C18 silica, allowing for direct visualisation of the mixing phenomenon. Use a series of different amounts of cyclohexanol in the injection plug allowed the pictures to be obtained which clearly demonstrated the effect of viscous fingering and also very nicely explained the peak distortions that were observed.
To address these issues, it is recommended where possible to ensure that there is compatibility with the analytes, injection/transfer solvents and the individual mobile phases that are being used. This may require an extensive series of injections for both the first and second dimensions but it will result in a much more robust methodology. Ideally, in all cases, the peak shape should be investigated as well as the detector linearity response as these are ideal markers to identify if the mixing is proceeding beneficially. However, as with all forms of chromatography, a balance will have to be established between all of the experimental parameters to optimise the chromatographic performance.
Two-dimensional liquid chromatography offers a substantial advantage over one-dimensional chromatography in being able to achieve much higher resolution, however, there are still significant challenges that have to be addressed, one of which is ensuring that the solvent/analyte compatibility throughout the analytical system. If these parameters are not considered carefully it will start to undermine the integrity of the data that is being produced and, in a world where data is being more scrutinised daily, separation scientists must play their part in ensuring that data-driven decisions are based on good scientific practice and that we have not overlooked something as simple as a solvent mismatch issue.
1. P. Schoenmakers and C. de Koster, LCGC Europe, vol. 15, no. 11, pp. 2-7, 2002.
2. A. Soliven and T. Edge, “Considerations for the Use of LCxLC,” Chromatography Today, pp. 34-38, May/June 2014.
3. B. Broyles, R. Shalliker, D. Cherrak and G. Guiochon, “Visualization of viscous fingering in chromatographic columns,” Journal of Chromatography A, vol. 822, pp. 173-187, 1998.
4. R. Shalliker, B. Broyles and G. Guiochon, “On-Column Visualization of Sample Migration in Liquid Chromatography,” Analytical Chemistry, vol. 72, pp. 323-332, 2000.
5. H. Quinn, “A Reconciliation of Packed Column Permeability Data: Column Permeability as a Function of Particle Porosity,” Journal of Materials , pp. 1-22, 2014.
6. F. Blake, “The resistance of packing in fluid flow,” Transcripts of the American Chemical Engineers, vol. 14, pp. 415-422, 1922.
7. P. Carmen, “Fluid Flow through Granular Beds,” American Institute of Chemical Engineers, vol. 15, pp. 150-166, 1937.
8. S. Burke and W. Plummer, “Gas flow through packed columns,” Ind. Eng. Chem., vol. 20, pp. 1196-1200, 1928.
9. V. Barabash, R. Abiev and N. Kulov, “Theory and Practice of Mixing: A Review,” Theoretical Foundations of Chemical Engineering volume, vol. 52, pp. 473-487, 2018.
10. O. Reynolds, “An experimental investigation of the circumstances which determine whether the motion of water shall be direct or sinuous, and of the law of resistance in parallel channels,” Philosophical Transactions of the Royal Society, vol. 174, p. 935–82, 1883.
11. A. Edge, Handbook of Analytical Sciences, I. D. Wilson, Ed., Elsevier, 2003, pp. 91-128.
12. P. Saffman and G. Taylor, “The penetration of a fluid into a porous medium or Hele-Shaw cell containing a more viscous liquid,” Proceedings of the Royal Society of London. Series A. Mathematical and Physical Sciences, vol. 245, no. 1242, pp. 312-329, 1958.
13. K. J. Mayfield, R. A. Shalliker, H. J. Catchpoole, A. P. Sweeney, V. Wong and G. Guiochon, “Viscous fingering induced flow instability in multidimensional liquid chromatography,” Journal of Chromatography A, vol. 1080, no. 2, pp. 124-131, 2005.
14. J. Fanchi and R. Christiansen, “Applicability of fractals to the description of,” Society of Petroleum Engineers Journal, vol. 23, no. 1, 1989.
15. G. Daccord, J. Nittmann and H. Stanley, “Radial viscous fingers and diffusion-limited aggregation: fractal dimension and growth sites,” Physical review letters, vol. 56, no. 4, pp. 336-339, 1986.