Help Desk
Published over 5 years ago. See the latest and most current information on Help Desk.
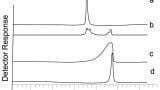
There are on occasion times when there is no obvious reason for the experimental arrangement and so it was when a colleague of mine, David Dunthorne, asked if it was necessary to use trifluoro acetic acid (TFA) in the determination of the chromatographic efficiency of a new column. Looking briefly at the compounds, ketoprofen and uracil, there did not appear to be a rationale as to why TFA should be used and on this basis TFA was replaced with formic acid, since the method was eventually going to be run on a mass spectrometer, where TFA can be quite detrimental to the detector response [1]. It was also felt that some of the UV detector ripple effects that can occur with the use of TFA [2] may be eliminated if the assay was moved to formic acid. The detector issues are associated with the relative high UV absorbance that TFA has compared to the mobile phase (ACN and water in this case) and the resulting sensitivity associated with the mixing process of the mobile phases.
The tests to determine the chromatographic efficiency are trivial and involve the sequential injection of an injection marker (uracil) and a retained compound (ketoprofen), at different flow rates. The mobile phase used was 0.1%TFA in 25:75 ACN:Water with the column thermostatted at 40°C. The data that is typically plotted is the flow rate or linear velocity of the mobile phase versus the chromatographic efficiency in the form of Height Equivalent to Theoretical Plates (HETP), which is a measure of the peak width.
The generated plots which were done on a range of solid core particles looked good and were in agreement with the expected results. However, it was noted that the retention factor varied with the flow rate, from 12 down to nearly 8. This is quite a significant impact on the retention factor and so further investigation was needed to determine the rationale behind the relative shift in retention times between the two compounds.
Where L is the length of the column and N is defined as;
tr is the retention time of ketoprofen
w0.5 is the peak width at half the height for ketoprofen
The equation defining the retention time can be written as;
Where;
c is a factor which relates to the retention mechanism and is generally assumed to be independent of the flow rate.
tr is the retention time of the analyte, in this case ketoprofen
Q is the volumetric flow rate
V0 is the volume of the chromatographic system between the injector and the detector.
Although retention time is often used to determine the time spent on the column a better variable to use is the retention factor, which is defined as.
The retention factor should not vary with flow rate since the equation uses the t0 value, which is associated with the retention of an unretained peak, uracil, and would compensate for the increase in flow rate.
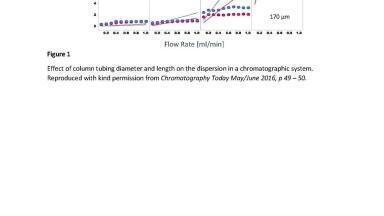
The retention factor data is shown in Figure 1, and it can be clearly seen that the retention factor does vary with the flow rate.
Figure 1. Effect of flow rate on the retention factor for ketoprofen.
As part of the investigation to determine the cause, the retention time for both compounds was plotted as a function of the flow rate and it could be seen that for both compounds a linear relationship was established between the flow rate and the reciprocal of the retention, and indeed the r2 value was very close to one, suggesting that the data was very good. The issues associated with the use of r2 was covered in a prior Helpdesk article, and this is probably a prime example [3]. If instead of relying on the r2 value, the accuracy of the predicted retention time versus the actual retention time is evaluated, the results are shown in table 1, then an interesting observation can be made. What was previously shown, as robust reliable data where the reciprocal of the retention time varying as a linear function of the flow rate, can be seen not to be so robust since the accuracy at low flow rates can be seen to drop quite dramatically.
Figure 2. Flow rate versus retention time, showing a linear response for both compounds.
Table 1. Accuracy of the predicted retention time as a function of the flow rate demonstrating that the relationship between flow rate and inverse retention time for ketoprofen is not linear.
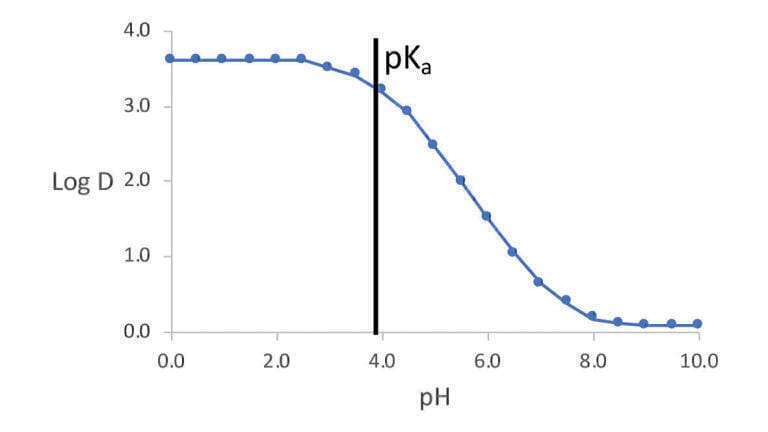
Based on the accuracy data, the flow rate is affecting the retention factor for ketoprofen and in turn this implies that it is affecting the retention mechanism. After some searching of the academic literature it was noted that several authors had noticed that the pressure could affect the retention times of compounds that are close to their pKa [4-9]. In this case increasing the flow rate was also increasing the pressure, and so closer inspection of the physiochemical properties of both analytes was undertaken. The log D plot for ketoprofen is shown in figure 3, with the pH for the pKa highlighted. Changing from 0.1% TFA to 0.1% formic acid changes the pH from 2.0 to 2.7, which is much closer to the pKa and as a result changes in pressure will affect the equilibrium between the charged and the uncharged forms of the molecule. Uracil has a pKa at a pH of 9 and so is not affected by pressure and hence flow rate in this case.
Figure 3. Log D plot for ketoprofen with the pKa highlighted calculated from www.chemicalize.org.
One of the rules of thumb that separation scientists are taught early in their career is to always work 2 pH units away from the pKa . In this case this would mean 3.9±2, which would mean that TFA would almost fit that rule, but formic acid would break it. The use of a pH that is within 2 pH units of the pKa , in this case results in the molecule being present in its charged form which explains the reduction in the retention factor. Other artifacts can be also observed when analysing analytes close to the pKa including peak distortion and irreproducible retention times. It should also be noted that changing the flow rate can also affect many other parameters that may be considered to be constant [24, including;
• physical dimensions of the column,
• particle size and porosity,
• phase ratio,
• column hold-up volume,
• mobile-phase density and viscosity,
• diffusion coefficients,
• equilibrium constants,
• and efficiency parameters.
Although pressure can affect all of these parameters the scale at which they are affected is very dependent on the exact physical configuration that is being used, and this will relate to the compound, the mobile phases and also the nature of the column housing. In this case it is the proximity of the mobile phase pH to the pKa that is causing the shift in retention factor.
It is easy to make an assumption that data that does match the pre-conceived answer has been obtained from a poorly performed experiment. As scientists it is important that we are able to interrogate the data in an appropriate fashion and ensure that we promote the truth as opposed to making an assumption that the process is wrong, resulting in wrong data. Science is based on observation and some of the greatest scientific discoveries have been based on what might be termed failed experiments. In these cases, it was the determination of the scientist to uncover the truth that eventually delivered the real answer. These lessons can be readily applied outside the scientific community and it is encouraging to see that more and more it is data that is driving decision making processes as opposed to a predetermined outcome.
1. Thomas M. Annesley, Clinical Chemistry 49:7 (2003)1041–1044
2. Winkler, G. LCGC, 1987, 5(12), 1044–1045
3. Help Desk, Chromatography Today, December (2015) pp. 69 - 70
4. J. Billen, K. Broeckhaven, A. Liekens, K. Choikhet, G. Rozing, G. Desmet, Influence of pressure and temperature on the physico-chemical properties of mobile phase mixtures commonly used in high performance liquid chromatography, J. Chromatogr. A, 1210 (2008), pp. 30-44
5. M. Martin, G. Guiochon, J. Chromatogr. A, 1090 (2005), pp. 16-38
6. McCalley, David V. Trends in analytical chemistry. 2014 63:31-43.
7. Åsberg, Dennis; Chutkowski, Marcin; Leśko, Marek; Samuelsson, Jörgen; Kaczmarski, Krzysztof; Fornstedt, Torgny, J. Chromatogr. A. 1479:107-120
8. A. Felinger, B. Boros, R. Ohmacht, Chromatographia, 56 (2002), pp. S61-S64
9. S. Fekete, J.-L. Veuthey, D.V. McCalley, D. Guillarme, J. Chromatogr. A, 1270 (2012), pp. 127-138