Help Desk
Published over 12 years ago. See the latest and most current information on Help Desk.
Complex separations involving thousands of components are becoming more common, particularly in the field of proteomics and metabolomics. In these scientific disciplines the greater the number of components that can be separated the greater the information will be in terms of identifying a specific protein or metabolite which potentially could have implications in determining new metabolic pathways or identification of protein biomarkers for a particular disease state. The range of compounds present in these types of samples is very broad, and readers have asked what is the correct process for choosing the most orthogonal columns to aid the separation? Thus in this month’s edition of the helpdesk we will look at how to ensure that the most appropriate degree of orthogonality is obtained thus ensuring that there is no loss n resolution for the target analytes.
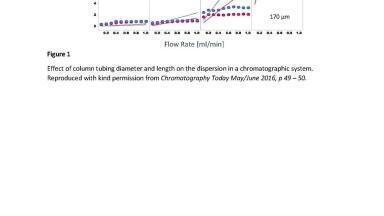
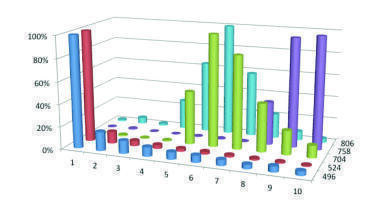
It is often assumed that having the most orthogonal columns will give the best separation, which is not exactly correct, and there are some very simple analogies can be made to demonstrate this. Consider trying to separate a range of coloured shapes. So in this scenario the two separation mechanisms could be based on the colour and also the shape itself. The intention being that the separation using these two mechanisms will result in all of the data set being defined by the colour and the shape. However, an understanding of the dataset may determine that a better separation is to use size and shape as this will give a better discrimination between all of the components of the dataset (there may only be two colours but many different sizes and shapes). Thus although, colour can be deemed to be an orthogonal mechanism for separating between the depending on the data set it may be that a better separation process would be to employ a less orthogonal approach to the separation mechanism. An optimal 2D separation as shown in Figure 1 will then result if the correct selection criteria are chosen.
A similar approach needs to be taken when looking at separating molecules when using two dimensional liquid chromatography. The parameters that are being used to drive the separation should be chosen to optimise the overall separation and this will depend to a certain extent on the nature of the molecules that are being separated and then in choosing two parameters that will allow for the greatest differentiation of the set of compounds chosen. It is the difference in the retention mechanisms that will ultimately drive the improvement in separation, and this depends on the phase but also on the molecules that are being separated.
Thus on many occasions the use of ion exchange and reversed phase is chosen, which given the nature of the most molecules is a good mix. These modes of interaction are far enough apart so that they will allow for differentiation of the modes of interaction but still related to the properties of the molecules so that there is relevance in the separation. It should be noted though that if the complex mixture was a mixture of acids and neutrals then the use of a cation exchange phase would exemplify the situation where the modes of interaction of the molecules are very different, but that one of the modes is just not relevant to the separation of the compounds under investigation.
There are different approaches to measure the orthogonality of the separation; a common approach is to measure the retention time correlation between two different columns, which is an indirect method to obtain how different the retention mechanisms are between the two columns. Possibly a better approach is to measure the retention time space that the two columns occupy for the sample set being analysed, as ultimately the improvement in resolution is dependent on this rather than the correlation factor. This can be achieved in a variety of methods from creation of boxes around the dataset, or by determining the fractional dimension of the data.
One of the limitations with finding the correlation between two columns is when there are very little differences in the retention time for one dimension for all of the compounds, which can still result in a very low correlation, but in terms of the retention time space that is filled this can be minimal, in a similar fashion to the shapes, sizes and colours problem posed earlier.
So to answer the question posed, how to ensure the most orthogonal columns it really does depend on the samples being analysed. Table 1 gives a summary of some of the orthogonal separations that have been performed with the columns used to obtain that separation and the specific application; hopefully this will be a good starting point for readers who wish to try 2D LC.