Ion chromatography (IC)
Published over 7 years ago. See the latest and most current information on Ion chromatography (IC).
The effect of viscosity and the relationship between viscosity and density is characterised for MeOH/C02 mixtures at 40°C. It appears that most SFC users equate higher pressure drops with higher density, which is often NOT true. At higher modifier concentrations (> ≈ 20%) and pressures (> ≈ 200 bar), the density of MeOH/CO2 mixtures actually decreases compared to lower MeOH concentrations at lower pressures. At the same time, pressure drops increase, indicating that the viscosity increases. Thus, the relationship between density, and viscosity is still poorly understood at many typical conditions used in SFC. There are no measured values for viscosity under the conditions used in SFC. There are 2 approaches published in the literature to calculate viscosity under SFC conditions, one producing dynamic viscosity and the other kinematic viscosity, but neither is clearly superior or more accurate. Correcting for differences in density they disagree only slightly, which is good. Here, data from one of the approaches is used to characterise the relationship between density and viscosity. The results indicate that density is a very poor indicator of retention, or pressure drops when modifier concentration is changed significantly. This is in clear contradiction to mainstream teaching where density is indicated as the primary control variable for retention. Changes in viscosity, not density, explains both pressure drops and changes in diffusion coefficients with pressure and modifier concentration.
A great deal has been written in recent years on the effect of density on retention under isocratic conditions in supercritical fluid chromatography (SFC) [1-5]. Such reports suggest that density is a major control variable. In fact, it is sometimes characterised as the most important control variable. This is a serious distortion. With polar solutes, changes in modifier concentration always have a much larger impact on retention [6], and efficiency, compared to changes in density.
Relatively high modifier concentrations (>20%) are often used, along with gradient elution. In addition, there is increasing use of sub-2µm particles which generate much higher system pressures. A common perception is that increasing modifier concentration always results in increasing density, along with increasing pressure drops.
The physio-chemical properties of MeOH/CO2 mixtures have not been significantly studied at such high MeOH concentrations and higher pressures. The relationship between density and viscosity remain poorly understood. The few empirical density measurements available for such mobile phases [7], are quite old and support this perception. When such reports were published, the modifier concentrations used in the literature seldom exceeded 10-20% and pressure was seldom > 200 bar. Not surprisingly, published density data only covers relatively low MeOH concentrations and low pressures. However, some pure modifiers, such as MeOH, are significantly less dense than CO2 at high pressures. At some intermediate MeOH concentrations and pressures, the density of CO2/MeOH mixtures should begin to decrease. Unfortunately, there are no published experimental data for density at such higher concentrations and pressures.
It has only been in the last few years that reasonably accurate values could be calculated for the density of CO2/MeOH mixtures. The REFPROP program [8-10] from NIST is reasonably accurate for calculating the density of CO2/MeOH mixtures. The results have not been widely accessible, although a small number of reports have appeared [5,11-13].
Viscosity is a much bigger problem. No empirical viscosity measurements exist for mixtures of CO2 with polar modifiers used in SFC, and any experimental approach is daunting. With increasing modifier concentration, pressure drops continue to increase, due to increasing molecular closeness, and subsequently, increasing viscosity. Unfortunately, REFPROP cannot generate accurate transport properties, such as viscosity, for such mixtures of a non-polar main fluid with a polar modifier.
A few approaches have appeared for calculating viscosities, but the results are somewhat inconsistent. Tarafder [5] used REFPROP to generate constant density (isopycnic) lines as a reference, and compared the calculated density of CO2/MeOH mixtures to old empirical density measurements and found fairly significant deviations near the critical points but relatively good agreement elsewhere. Tarafder then calculated and plotted all the temperatures and pressures that gave the same density with the same composition. These plots contain the ratio of ρ/η, where η is dynamic viscosity, and ρ is density. This ratio is proportional to kinematic viscosity. To convert such data to actual values for kinematic viscosity required another estimation, in this case of column porosity, the only non-constant in the differential version of Darcy’s Law [5]. With an estimation of column porosity, values were assigned to each kinematic viscosity curve. Mixtures ranged from 5% to 20%. There are many assumptions, approximations, and estimations in these numbers that make the results questionable.
Fekete [3] took a completely different approach in calculating dynamic viscosity of MeOH/CO2 mixtures. He used some empirical data [14] on the viscosity/density of CO2/MeOH mixtures where a liquid phase was in contact with a vapor phase at low pressures (<80 bar). He then extended correlations to conditions at higher pressures and temperatures, between 0% and 40% MeOH. Extrapolating the low pressure data to much higher pressures (through the critical points) is a bit of a stretch since there is a poor relationship between density and viscosity in fluids where the modifier is much less dense than the CO2 at higher pressures. Surprisingly, this is actually a fairly common approach [15] using the same underlying assumptions and similar data. The authors [3] claim to have checked the calculated values with a few measured values with good agreement, without providing details. These results were reported as dynamic viscosity in centi-Poise.
The 2 sets of data don’t quite fit, but are close, when Fekete’s [3] results are divided by density (to generate kinematic viscosity) or when Tarafder’s [5] data is multiplied by density (to generate dynamic viscosity). The differences are not very large and the curves have the same general shape.
In a recent report, from this laboratory [11], the changes in density, with high modifier concentrations and high pressures were briefly characterised with respect to retention, efficiency, and pressure drops, using density data from REFPROP. A missing link in understanding efficiency, pressure drops, and optimum flow rate has been the lack of accurate viscosity values and the relationship between viscosity, density, and pressure drops at pressures > ≈ 200 bar, and methanol concentrations > ≈ 20%. In the present work, the viscosity results from Fekete [3], which covers a wider range of MeOH concentrations, up to 40%, were extrapolated to lower intermediate concentrations and compared to density data from REFPROP at the same compositions and temperature.
Chromatograms were collected using a Model 4301A 1260 Infinity II SFC, controlled by a Model C.01.08 (210) Chemstation, all from Agilent Technologies, Waldbronn, DE (Germany). The instrument consists of a SFC conversion module, a binary pump, a Multisampler, thermostated column compartment, and a 120 Hz diode array detector (DAD). Standard 170µm tubing, including 2 heat exchangers was used throughout, except for a 50 cm piece of 120µm tubing serving as the inlet tube of the flow cell. The flow cell volume was 13µL with a 10mm flow path length. The column was 4.6 x 150mm packed with 5µm RX-Sil from Agilent Technologies, Little Falls, DE, USA.
The Agilent SFC is fairly unique in that the binary pump does not compress the CO2 significantly. It is pre-compressed to 8 bar below the delivery pressure by the SFC conversion module. The binary pump only meters the flow. Since the CO2 half of the binary pump does not compress, there is almost no heat of compression and no ambiguity about the temperature of the CO2 that is being delivered. Knowing the pump temperature, and the delivery pressure, one can obtain the density of each pure fluid from REFPROP. The pump delivers v/v%. If one knows the density of each fluid, and the volumetric displacement of each pump vs. time, one then knows the actual Mole%. Conversely, it is fairly easy to convert Mole% to v/v%. With other SFC’s it is more difficult due to high heats of compression. With significant pump compression, the temperature of the fluid is not the temperature of the pump head.
Theobromine was obtained from Sigma-Aldrich, St. Louis MO, USA (> 98%, used as received). The CO2 was beverage grade, from Terry Supply Co., Bradenton, FL, USA, in 50 lb cylinders, without a DIP tube. The HPLC grade MeOH and IPA was purchased from SECO, Aston, PA, USA. The samples were dissolved in methanol. The ‘feed’ solvent used in the autosampler was isopropyl alcohol.
Density calculations from REFPROP [8-10] for CO2/MeOH mixtures at 40°C are shown in Figure 1. These calculations yield densities at Mole%. At low modifier concentrations and low pressures, density increases dramatically with small increases in methanol concentration, and to a lesser extent with increasing pressure. This is consistent with the general perception of most users. However, at only ≈ 200 bar the density of pure CO2 is about the same as the density of 50% methanol in CO2. Even 5% MeOH is denser than 50%. This is completely counter to the general perception about MeOH concentration and density. Above 300 bar, pure CO2 is denser than any mixture of methanol in CO2! This has not been adequately articulated, previously, and indicates that the preoccupation with density as a control variable, by some users, is ill-founded, and counter-productive.
For somewhat polar compounds, such as small drug-like molecules, retention is usually a strong function of polar modifier concentration, but it is sometimes suggested that density is also a major control variable. With the data in Figure 1, it is fairly easy to show the effect of the changes in density due to changes in modifier concentration and pressure on retention. Theobromine was eluted from a 4.6x150mm, 5µm RX-Sil (bare silica) column using various back pressure regulator (BPR) settings and methanol concentrations. The flow was set to 2mL/min, with 40°C oven set temperature, which is near the optimum flow rate under these conditions.
The pressure drops were modest (≈ 35 bar, mostly in the column) so the average of the pump pressure and the BPR pressure was used as the average column pressure, which in turn, should indicate the approximate average density in the column. The retention factors are plotted against methanol concentration in Figure 2a, while the average density in the column, under the same conditions, is plotted in Figure 2b. Clearly, the dramatic decrease in retention with increasing modifier concentration is not caused by increasing density, since the density often decreases.
Increasing pressure has its greatest effect on retention at low modifier concentrations, although modifier concentration is always more important [6]. At 5% MeOH, retention is nearly halved when the BPR pressure is increased from 100 to 300 bar but in both cases, retention is excessive (k ≈ 9-16). However, at higher MeOH concentrations, pressure becomes progressively less important. All this has been partially documented [11] but what about the relationships between density, viscosity, and pressure drops?
The viscosity data of Fekete [3] was used as a basis for quadratic estimation of the viscosities at 100 bar. Then, viscosity values were extrapolated for intervening values of methanol concentration, and the results are presented in Figure 3. The values at 0% were compared to values for pure CO2 from REFPROP and reasonably agreed.
In Figure 4a, the viscosity of the mobile phase, at the pump, using the data in Figure 3, is plotted against the modifier concentration. In Figure 4b, the pump pressure at the same flow rate and temperature, is plotted against the viscosity. Both plots are linear and the calculated increasing viscosities appear to be consistent with increasing system pressure drops, as one would expect.
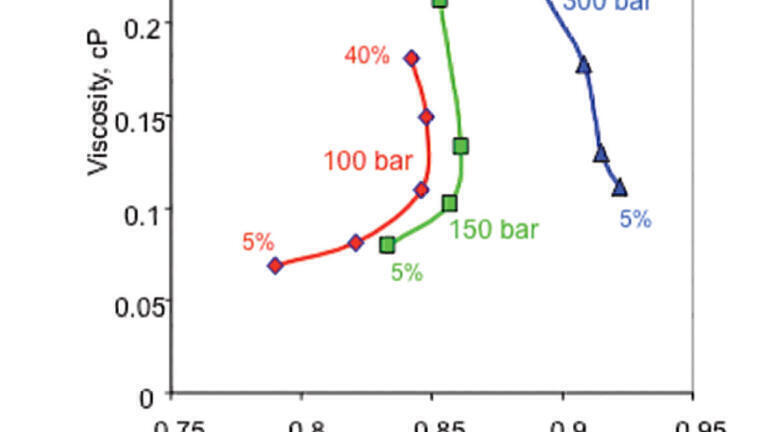
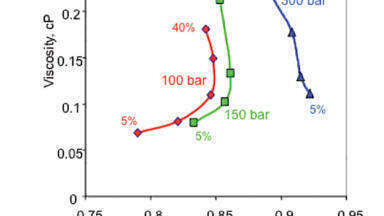
The calculated viscosity from Figure 3 was plotted against calculated density from Figure 1. The results are presented in Figure 5. At low pressures (100-200 bar), the density initially increases up to ≈ 20-25% methanol, consistent with most users’ perceptions. However, at higher MeOH concentrations, the density then decreases, while viscosity increases. At 300-400 bar, the density actually decreases almost linearly, while viscosity increases with increasing modifier concentration. Thus, at higher pressures the relation between density and viscosity is actually opposite to the general expectation. All the relationships in Figure 5 are calculated.
The average pressures in Figure 2 were also plotted as density vs viscosity values is presented in Figure 6. The pressures next to the curves were the BPR pressure. The results mirror the results in Figure 5. Thus, the pressure drops in a real column produced similar results.
The relationship between density and viscosity of MeOH/CO2 mixtures used in SFC is complex. In fact, at higher modifier concentrations, or higher pressures, the relationship is confused or essentially opposite to most users’ perceptions. This makes density less than useless, and, in fact, incorrect in determining retention or pressure drops at higher MeOH concentrations or pressures. This is counter to most of the recent SFC literature recommendations which stress relationships between density and retention. Changes in viscosity, not density, explains both pressure drops and changes in diffusion coefficients with pressure and modifier concentration. Unfortunately, viscosity data are nearly non-existent.
1. A. Tarafder, G. Guiochon, ‘Use of isopycnic plots in designing operations of supercritical fluid chromatography: I. The critical role of density in determining the characteristics of the mobile phase in supercritical fluid chromatography’, J. Chromatogr. A, 1218 (2011) 4569–4575.
2. E. Lesellier, L. Fougere, D.P. Poe, ‘Kinetic behavior in supercritical fluid chromatography with modified mobile phase for 5µm particle size and varied flow rates’, J. Chromatogr.A, 1218 (2011) 2058-2064.
3. A. Grand-Guillaume Perrenoud, C. Hamman, M. Goel, Jean-Luc Veuthey, D. Guillarme, S. Fekete, ‘“Maximizing kinetic performance in supercritical fluid chromatography using state-of-the-art instruments’, J. Chromatogr. A, 1314 (2013) 288-297.
4. S. Delahaye, K. Broeckhoven, G. Desmet, F. Lynen, ‘Design and evaluation of various methods for the construction of kinetic performance limit plots for supercritical fluid chromatography’, J. Chromatogr. A, 1258 (2012) 152-160.
5. A. Tarafder, K. Kaczmarski, D. P. Poe, G. Guiochon, ‘Use of the isopycnic plots in designing operations of supercritical fluid chromatography. V. Pressure and density drops using mixtures of carbon dioxide and methanol as the mobile phase’, J. Chromatogr. A, 1258 (2012) 136–151.
6. T.A. Berger, J. F. Deye, “Composition and Density Effects Using Methanol/Carbon Dioxide in Packed Column Supercritical Fluid Chromatography” Anal. Chem. 1990, 62, 1181-1185.
7. T.A. Berger, ‘Density of Methanol-Carbon Dioxide Mixtures at Three Temperatures’, J. High Resolut. Chromatogr., 1991, 14, 312-316.
8. E.W. Lemmon, M.L. Huber, M.O. McLinden, NIST Reference Database 23: Ref-erence Fluid Thermodynamic and Transport Properties REFPROP, Version 9.1,National Institute of Standards and Technology, Standard Reference Data Program, Gaithersburg, MD, 2013.
9. O. Kunz, R. Klimeck, W. Wagner, M. Jaeschke, ‘The GERG-2004 Wide-Range Equation of State for Natural Gases and Other Mixtures GERG Technical Monograph’. Fortschr.-Ber. VDI, VDI-Verlag, Düsseldorf (2007)
10. O. Kunz, W. Wagner, ‘The GERG-2008 wide-range equation of state for natural gases and other mixtures: an expansion of GERG-2004’, J. Chem. Eng. Data, 57 (11) (2012), pp. 3032-3091.
11. T.A. Berger, ‘Effect of density on kinetic performance in supercritical fluid chromatography with methanol modified carbon dioxide’, Chromatogr. A, 1564, 2018, 188-198.
12. A. Tarafder, G. Guiochon, ‘Use of isopycnic plots in designing operations of supercritical fluid chromatography: II. The isopycnic plots and the selection of the operating pressure–temperature zone in supercritical fluid chromatography’, J. Chromatogr., A, 1218 (2011) 4576– 4585.
13.] A. Tarafder, G. Guiochon, ‘Use of isopycnic plots in designing operations of supercritical fluid chromatography. III: Reason for the low column efficiency in the critical region’, J. Chromatogr A, 1218 (2011) 7189–7195.
14. R. Sih, F. Dehghani, N. R. Foster, ‘Viscosity measurements on gas expanded liquid systems-Methanol and carbon dioxide’, J. Supercrit. Fluids, 41, 2007, 148-157.
15. H. Matsuda, K. Kurihara, K. Tochigi, T. Funazukuri, V.K. Rattan, ‘Estimation of kinematic viscosities for CO2 expanded liquids by ASOG-VISCO model’, Fluid Phase Equilibria 470 (2018) 188-192.


-(1).jpg)