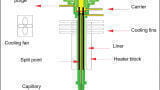
HPLC, UHPLC
Published over 8 years ago. See the latest and most current information on HPLC, UHPLC.
The number of cannabis testing laboratories has expanded, as an increasing number of states have adopted medicinal and/or recreational cannabis use programs. Potency testing is of particular concern when the cannabis is to be used for medical treatment or research. Thus, analytical standards for the primary components of cannabis are of the utmost importance. Historically-used analytical methods have had drawbacks regarding method robustness and long sample turnaround time. This manuscript describes the development of a simple, accurate, and reproducible analytical method for the chromatographic separation and quantitation of seven primary cannabinoids in cannabis extracts by high performance liquid chromatography (HPLC) with photodiode array (PDA) detection, using an SPP (superficially porous particle) column.
Introduction
In the United States, the federal Controlled Substances Act (CSA) of 1970 makes illegal the use and possession of cannabis for any purpose. Under the CSA, cannabis is classified as a Schedule I substance, meaning it has a high potential for abuse and no accepted medical use, thereby prohibiting even medical use of the drug [1]. At the state level, however, policies regarding the medical and recreational use of cannabis vary greatly, and many state policies conflict with federal law.
In 1996, California became the first state to legalise the medical use of marijuana. Since then many more states have enacted cannabis programs, the most recent being the state of Vermont which legalised adult use of marijuana in January 2018. As of March 2018, 29 states, the District of Columbia, Guam, and Puerto Rico have enacted public medical marijuana and cannabis programs. Another 17 states have approved the medicinal use of products that have high levels of cannabidiol (CBD), a non-psychoactive component of cannabis, as long as the product has low levels of the psychoactive component tetrahydrocannabinol (THC). These ‘high CBD/low THC’ programs typically include restrictions on the types of medical conditions for which such products can be used [2. Between the years 2012 and 2018, nine states and the District of Columbia expanded their programs to include ‘retail/adult’ recreational use of marijuana [3].
As the legality and use of marijuana has spread across the nation, so has its cultivation and, concurrently, the number of analytical laboratories conducting state-required testing of marijuana crops [4]. Comprehensive cannabis testing covers a range of targets, including THC and CBD, terpenes, microbiological and pesticide contaminants, and heavy metals via absorption from the soil during cultivation. For all of these parameters of concern, reliable and accurate analytical methods are pivotal to ensuring the quality, safety, and potency of cannabis products.
Potency testing is of particular concern when the cannabis is to be used for medical treatment or research. Thus, analytical standards for the primary components of cannabis are of the utmost importance. Naturally occurring cannabinoids, the main biologically active component of the cannabis plant, form a complex group of closely related compounds of which 113 are known and 70 are well described. The primary focus has been on Δ9-tetrahydrocannabinol (THC), the primary active ingredient in cannabis, due to its psychoactive, pharmacological, and toxicological characteristics, upon which strict legal limits have been enforced. However, analytical labs must also focus on Δ9-tetrahydrocannabinolic acid (THC-A), the naturally occurring precursor to THC that is readily decarboxylated to THC during the drying and/or heating of cannabis.
Many efforts to standardise cannabis testing have used standard solutions of different cannabinoids for method development. Yet, the complex matrix of compounds in cannabis is very different from a pure standard solution and, thus, the development of a reproducible method to be used for whole cannabis testing requires the use of actual cannabis samples [5].
Gas chromatography/mass spectrometry (GC/MS) has historically been used for the separation and quantitation of the compounds of interest in cannabis. However, a limitation of the use of GC for cannabinoid analysis involves distinguishing between THC and THC-A. In order to obtain distinct data for these two compounds, an additional process must be completed to derivatise the sample so THC-A is not converted to THC by the heat of injection [6].
This manuscript describes an analytical method for the chromatographic separation and quantitation of seven primary cannabinoids in C. sativa extracts by HPLC with PDA detection. This method is simple, accurate, and reproducible, provides improved turnaround time, and precludes some of the challenges posed by GC/MS analysis of cannabis components and costs of UHPLC.
Experimental
Hardware/Software
A PerkinElmer® (Shelton, CT, USA) Flexar™ HPLC system was used with a PDA (photodiode array) detector and accompanying CDS system. A PerkinElmer Brownlee™ SPP C18, 2.7 µm, 3.0 x 150 mm column was used for all analyses.
LC Parameters
The LC method parameters are listed in Table 1.
Solvents, Standards,
and Samples
All solvents and diluents used were HPLC grade and filtered via 0.45-µm filters. All diluents were 80:20 methanol/water. The 1 mg/mL (in 1 mL of methanol) standards of Δ9-tetrahydrocannabinol (THC), Δ9-tetrahydrocannabinolic acid (THC-A), cannabidiol (CBD), cannabidiolic acid (CBDA), cannabigerol (CBG), cannabinol (CBN), and cannabichromene (CBC) were obtained from Sigma-Aldrich®, Inc. (Allentown, PA, USA) and Restek Corporation (Bellefonte, PA, USA).
A 100-µg/mL working standard of the seven standards was prepared by adding 1 mL of each standard to a 10-mL volumetric flask and filling to mark with the 80:20 methanol/water diluent. This working standard also served as the level-6 calibration standard. Calibration standards at 50, 20, 5, 1, and 0.5 µg/mL were then prepared via serial dilution of the working standard.
Four 5-mL prepared cannabis extract samples, A through D, were obtained from 3B Analytical® (Portland, OR, USA), a cannabis testing laboratory. The lab prepared the extracts by adding 10 mL of methanol to one gram of dried and ground cannabis flowers. The samples were then vortexed for three minutes followed by filtering of 2 mL of supernatant using a 0.45-µm filter. The filtered supernatant was then diluted 3-fold with methanol. This resulted in an overall 30-fold concentration dilution with respect to the initial product. Upon receipt, each sample was further diluted 100-fold with diluent and held under refrigeration.
This considerable dilution was required to stay within the concentration range of the calibrants (0.5-100 µg/mL). Cannabinoid standards are commercially (and legally) only obtainable at 1 mg/mL. Therefore, once prepared as part of the calibration mix, the individual analyte concentration at the highest level was 100 µg/mL. This level is considerably lower than that expected for some cannabinoids in undiluted cannabis extract, particularly for THC-A; hence, the significant dilution requirement of the samples. All calibrants and samples were subsequently filtered through 0.45-µm filters and then injected (4 µL).
Results and Discussion
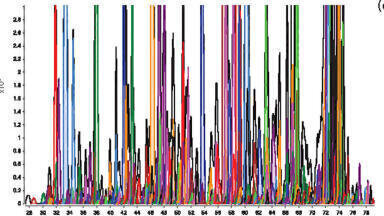
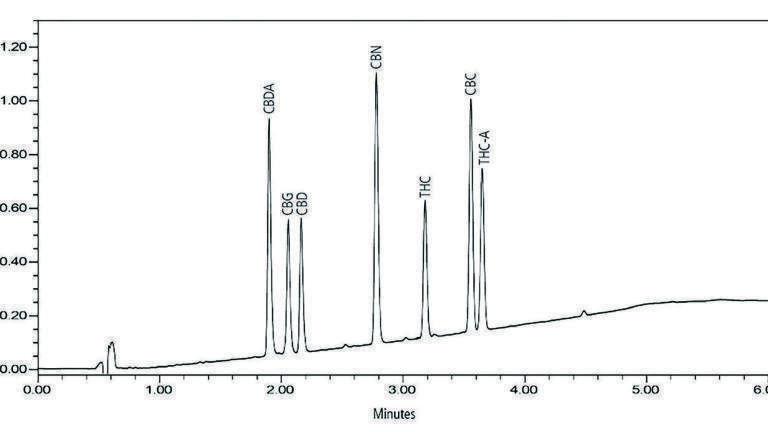
Figure 1 shows the chromatogram of a standard mixture containing the seven target cannabinoids, all separated in under four minutes. The gradient ramp was due to the relatively low concentrations of the high-end calibrants, again, limited by the obtainable concentrations of the standards. As shown in Figure 2, chromatographic repeatability was demonstrated via ten replicate injections of the 100-ppm standard mixture. The retention time %RSD for all peaks was less than 0.05%. This confirms the reliable performance of this chromatographic method, which is essential for ensuring the integrity of the results for medicinal cannabis analysis. In the medicinal cannabis industry, confident product composition is pivotal in helping to ensure the safety of released products.
Representative 6-level linearity plots for THC and THC-A, are shown in Figure 3. The R2 values for all seven cannabinoids were above 0.999. As listed in Table 2, LOQs (limits of quantitation) were established for each cannabinoid based on calibration standard responses. The LOQs (≥10 S/N) were ≤0.10 µg/mL for all analysed cannabinoids. As cannabinoids are typically tested for high-end potency, these LOQs are well below the current concentrations of interest for the primary cannabinoids being analysed.
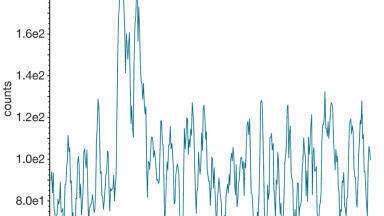
Figure 4 shows the chromatographic results for each sample. Comparing chromatograms, none of the samples showed any detectable levels of CBN, and only Sample A showed any detectable amount of CBC. Sample A appeared quite different from the others in that it contained a significantly greater proportion of CBDA, and significantly less THC and THC-A. It was also the only sample found to contain quantitatable amounts of CDA and an unknown matrix component, eluting on the backside of CBDA. Otherwise, Samples B, C, and D appeared quite similar to one another.
Table 3 shows the detected concentrations for the seven target cannabinoids in each sample. The detected concentrations were verified by 3B Analytical as agreeing with the expected values obtained by an independent GC-based analysis. Sample A exhibited a significantly higher CBDA concentration and, thus, points toward an outlier-type cannabis strain, one that may peak considerable interest for possible medicinal purposes. Sample B showed the highest concentration of THC-A, setting it apart from the other samples and making it a relative front-runner for recreational purposes. Samples C and D were quite similar, both chromatographically and quantitatively, suggesting they were from similar cannabis strains.
Conclusion
This study demonstrated the effective chromatographic separation and quantitation of seven cannabinoids, including THC and THC-A, in cannabis extracts using HPLC and PDA. The method provided exceptional linearity for each of the seven cannabinoids over the tested concentration range, and the sample results were verified to be consistent with those obtained by independent GC-analysis.
The separation was accomplished via conventional HPLC, using an SPP column, in less than four minutes, thus reducing turnaround time and avoiding the higher costs associated with UHPLC. PDA quantitation provided excellent sensitivity, precluding the need for quantitation by mass spectrometry.
Acknowledgements
The author would like to thank Meghan Brock of 3B Analytical for kindly offering to prepare and provide the sample extracts used for this study, as well as for providing product details to help analyse and verify the sample results.
References
1. U.S. Department of Justice, U.S. Drug Enforcement Agency. DEA Position on Marijuana. April 2013.
2. National Conference of State Legislatures. State Medical Marijuana Laws. March 28, 2018. http://www.ncsl.org/research/health/state-medical-marijuana-laws.aspx#2. Accessed on March 29, 2018.
3. National Conference of State Legislatures. Deep Dive: Marijuana. http://www.ncsl.org/bookstore/state-legislatures-magazine/marijuana-deep-dive.aspx. Accessed on March 29, 2018.
4. Tulsi, B. A Bright Future for Cannabis Testing Services. Lab Manager 11(9):10-16. October 2016.
5. Egerton, D. Defining Cannabis Standards in a Green Market. February 17, 2017. https://www.labcompare.com/10-Featured-Articles/333962-Defining-Cannabis-Standards-in-a-Green-Market/. Accessed on March 29, 2018.
6. James, A. Gas Chromatography: A Powerful Tool for Cannabinoid Analysis. Chromatography Today 11(1):40-43. Feb/Mar 2018.