GC-MS
Published over 10 years ago. See the latest and most current information on GC-MS.
Most laboratories that use gas chromatography (GC), have at least one GC hyphenated with a mass spectrometer (GC-MS) these days. GC-MS has added advantages over GC detectors in that it provides a third dimension of data in the form of a mass spectrum (Figure 1a). The sum of the abundance of all ions at each scan number (data point) produces the total ion current, which is represented as the total ion chromatogram (TIC) and is a 2D plot similar to the data produced from a non-MS GC detector. Extracting a single ion from the 3D plot (Figure 1b), gives an extracted ion chromatogram (EIC) and is useful for finding a target compound or looking for classes of analytes that contain the same ion.
Many analysts use the mass spectra for identification of unknown analytes, whilst others use it for confirmation and increased confidence that they have found and identified the correct analyte. When performing GC-MS analyses we have two methods of achieving resolution (peak separation). The first is chromatographic resolution, where analytes in the sample mixture are physically separated by their selective interaction with the stationary phase of the analytical column and elute at different retention times. The second is spectral resolution, where analytes eluting at similar retention times (that don’t have total chromatographic resolution) are separated by their different (unique) mass to charge ratios by the mass analysing detector. Those analytes with exactly the same peak retention time and shape plus that have all the same masses cannot be separated by GC-MS using that method.
Selecting any point within the Total Ion Chromatogram, will show the ion abundance versus mass to charge ratio, called the mass spectrum (Figure 1c) and these were the detected ions that were summed to give that data point. If there is total chromatographic resolution, the resulting mass spectrum will be obtained containing the mass spectrum for just that peak plus any background ions from carrier gas impurities and column bleed. If that peak is chromatographically impure, then this will result in a mixed mass spectrum, which may contain a low or high proportion of ions from the co-eluting peak, depending on the relative abundance of that peak. The percentage of the total ion signal at the peak apex belonging to the peak of interest is known as the peak purity [1].
If, by GC-MS, we analyse individual standards of our target analytes, we obtain a retention time and mass spectrum for each. When these targets are analysed in a simple mixture and there are chromatographic co-elutions, unique masses could be identified in their mass spectra that aren’t present in coeluting peaks and the presence and ratios of these ions could be used to identify and quantify them.
When we are extracting mass spectra to identify unknown components, it can be difficult to see if there are any co-elutions with other components. A co-elution would produce a mixed mass spectrum and when library searched that mixed mass spectrum would most likely result in a poor quality match, no potential matches or the incorrect identification. There are ways to check for co-elutions, this can be achieved manually by either clicking across the peak to see if the mass spectrum changes (Figure 2) or by extracting key ions to produce EICs, which when overlaid should show the same retention times and shapes indicating that they all belong to the peak of interest. There are ways to improve the quality of the mass spectrum for library searching, the most common by background subtraction on both sides. However, in most software performing both background subtraction and extracting ions manually can be a lengthy and time consuming process especially when looking at many peaks in chromatogram, and/or when there are many samples.
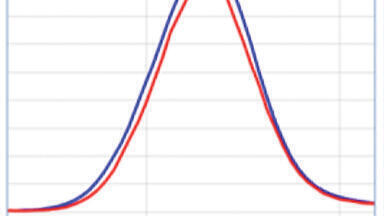
Figure 2: TIC looks like 1 peak, EICs show 3 peaks with different apexes, clicking across the peak shows a change in the mass spectrum. Slight changes in the mass spectrum can be a result of spectral skewing (otherwise known as spectral tilting) for scanning instruments (Figure 3).
Even with the identification of target analytes in dirty or complex samples using their unique masses in either scan or SIM acquisitions, matrix interferences can co-elute with the target analytes. If their mass spectra contain one or more of the target analytes’ unique masses this could result in mis-identification or most commonly false negatives due to the ion ratios for the target being incorrect, the target analyte is not identified and therefore deemed to be not present in the sample.
So, whether target analysis is being performed in more complex samples or unknowns are being identified, ensuring that a pure mass spectrum or ions are extracted is important for identification.
Deconvolution is an automated process, capable of detecting differences in the mass spectra across a peak which can indicate co-elutions. Mass spectra across a peak should be identical (after de-skewing spectra from scanning instruments (Figure 3)), with extracted ions for the analyte having both the same apex (retention time) and peak shape. Changes in the peak apex or peak shape could indicate another peak is chromatographically co-eluting (Figures 2 and 6). An algorithm in the deconvolution program, then derives a mass spectrum for each peak which is high quality and library searchable, ready for identification (Figure 4). In the broad sense deconvolution is the process of extracting one signal from a complex mixture of signals [2] (Figure 5).
There are several sources of deconvolution programs which are either built into the GC-MS data analysis software by the instrument manufacturer or are available as an add-on and are capable of processing most GC-MS data files produced using many different instruments. Some suppliers give details of how their software performs the deconvolution but all of them use different algorithms and therefore it is possible to get slightly different results using each one.
The main steps in the deconvolution process, the exact steps and order are software dependent, are to define and handle the noise, de-skew the data, find the peak apexes for each ion (ions belonging to the same peak should have the same apex), track the rate of rise and fall for each ion profile (check the peak shape) and finally produce a deconvoluted mass spectrum for each peak (Figure 6). Most software can also automate the library search against commercial or user-created databases and use the retention index (or time) from the database as a qualifier, to check that the correct isomer has been identified.
In terms of optimising the deconvolution software, again this is very software dependent, but could result in some peaks not being deconvoluted (mixed mass spectra still occur) or too many ions being removed and entered as additional peaks when they all belong to the same peak (too many peaks found and too few ions for identification). It might be possible (or necessary) to optimise integration parameters or change the sensitivity to determine how small the ions or peaks are to be deconvoluted, this could also be applied as a filter after deconvolution has taken place. Parameters that consider the degree of chromatographic co-elution (or resolution) could be present. The sensitivity of the peak shape – should the ions be a similar shape or exactly the same shape for them to be included/excluded in the mass spectrum?
No matter which deconvolution algorithms are used, they all benefit from obtaining high quality GC-MS data. There should always be some chromatographic resolution, as total co-elution of peaks with the same apex and shape cannot be deconvoluted. The best chromatography for the application should be achieved, as sharp, Gaussian peaks are easier to deconvolute. The mass range acquired should be applicable to the application, deconvolution cannot solve identification problems due to the low mass being too high or the high mass being too low. Optimise the number of data points across the peak through considering the baseline peak width and acquisition rate, generally a minimum of 10 scans is required to improve the peak shape and enable accurate identification of the apex, resulting in the ability to deconvolute closely co-eluting peaks. But too many data points (working to a maximum of 30 is optimal) can result in excess noise, this can lead to false apexes in the peak shape and additional peaks with the same mass spectra or containing very few ions being deconvolved. Any data system will process large, sharp peaks with a good signal to noise better than working on peaks present in the noise region. Reducing noise and improving signal can be applied throughout the GC-MS system from carrier gas to MS detector and sample preparation. Having some noise is good for the deconvolution software to be able to define the noise and therefore remove it in the process of producing the deconvoluted mass spectra. It can also means that peaks can be larger, as the base of them is deconvoluted from the noise region rather than the potential loss of the bottom part of the peak through using incorrect threshold values in the acquisition method.
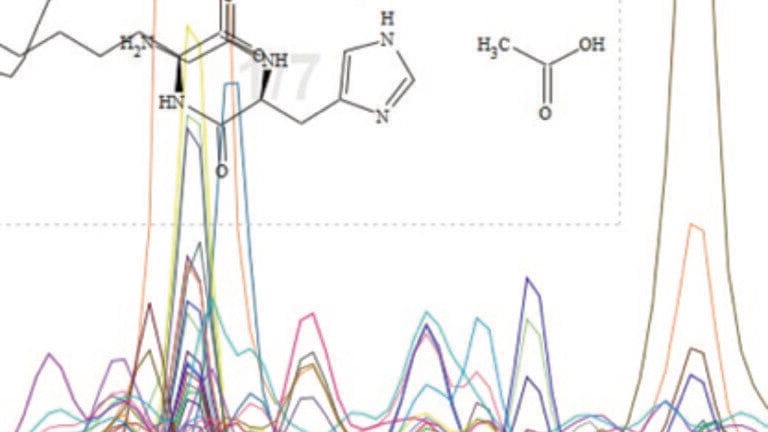
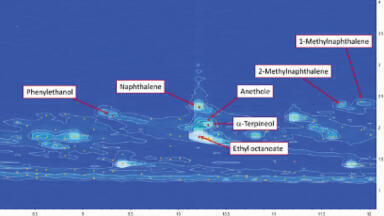
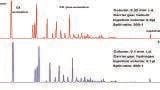
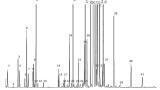
So, when and which deconvolution software should be used? The decision to employ deconvolution when identifying unknown or target analytes in complex sample is easy, particularly where it is impossible to obtain a high quality mass spectrum by background subtraction and result in a good library match. From semi-volatile organic compounds (SVOCs) in environmental samples (Figure 7) to chemical warfare agents in diesel oil (Figure 8) to aroma profiling in cheddar cheese (Figure 9), deconvolution enables the extraction of library searchable mass spectra. However, even an experienced chromatographer can be caught out by a matrix interferent in a relatively simple analysis resulting in the mass spectrum not making sense. Or we know an analyte is present in a SIM method but the ion ratios for what we thought were unique ions are erroneous. Performing library searches through huge databases is easy today, but does the result really match the application, is the match quality good enough, are there ions that look out of place? Deconvolution software comes in several forms and the best solution depends on the way you work along with your other analytical requirements. Some software packages involve set-up and optimisation of the parameters but allow control over what is found, others have no parameters and just work. Several options are offered from being embedded in the data analysis software, or as an add-on to the library, as part of the database software or even as an independent standalone piece of software, most enable you to ‘try before you buy’. Having deconvolution software that has been evaluated, tested and learned to trust is useful for any mass spectrometrist. Deconvolution is another tool that can add more power to your future methods but can also be used on data that you have already acquired.
[1] NIST’s AMDIS definition of Purity, AMDIS help file section 3.3.3.1 Purity
[2] NIST’s AMDIS definition of deconvolution, AMDIS help file section 13 Glossary
[3] Courtesy of Leco Instruments using ChromaTOF software
[4] Courtesy of ACD/Labs using Spectrus software
[5] Courtesy of Markes International using TargetView


-(1).jpg)

2.jpg)