Electrophoretic separations
Published over 7 years ago. See the latest and most current information on Electrophoretic separations.
Imaged capillary isoelectric focusing (iCIEF) is a powerful technique used in many biopharmaceutical laboratories responsible for evaluating the charge heterogeneity of proteins. Bottlenecks occur in the manual preparation of different samples and variability of test results is introduced by the technician. Some proteins are not stable in the presence of ampholytes which must be added to the sample immediately prior to injection. In this article we have demonstrated that automated mixing of the sample by the autosampler, or on-board mixing, prior to injection delivers comparable results to manual mixing, as determined by peak area percentage and pI precision, while saving the user time spent in sample preparation.
ADC, antibody-drug conjugate; CIEF, capillary isoelectric focusing; CQA, critical quality attribute; iCIEF, imaged capillary isoelectric focusing; IEF, isoelectric focusing; mAb, monoclonal antibody; PAP, peak area percentage; pI, isoelectric point; PTM, post-translational modification; RSD, relative standard deviation; WCID, whole-column image detection; UV, ultraviolet
Monoclonal antibodies (mAbs) are an increasingly important subset of therapeutic proteins [1]. The targeted nature of mAbs and associated medicines such as antibody-drug conjugates (ADCs) offers more disease-specific biodistribution in the body when compared to traditional small molecule medicines [2]. Further, mAbs are manufactured relatively quickly and easily using hybridoma technology [3].
mAbs are produced in bioreactors but structural variation like hydrolysis, deamidation, oxidation, glycosylation, and deglycosylation will occur during production as well as degradation during storage [4]. This generates variability in the surface charge of the therapeutic proteins produced, or charge heterogeneity [5]. Charge heterogeneity is a structural critical quality attribute (CQA) of mAbs [6].
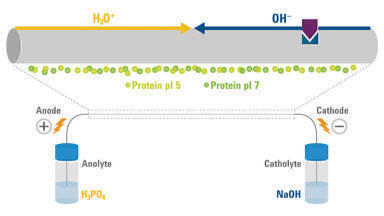
The platform technology for determining and quantifying charge heterogeneity is capillary isoelectric focusing (CIEF). CIEF is a CE method in which amphoteric compounds called ampholytes generate a pH gradient when a voltage is applied. During focusing, proteins that vary in their overall charge will migrate along the gradient to where the pH is equal to their isoelectric point (pI) [7]. In CIEF there is a single point of detection where they are visualised using ultraviolet (UV) light that requires the focused proteins to be slowly pushed past the point of detection. However, the separation resolution suffers during the mobilisation step [8].
Imaged CIEF (iCIEF) uses a whole-column image detection (WCID) cartridge; the entire separation capillary is illuminated with UV light eliminating the need to mobilise the focused protein and thus conserving the obtained resolution in the focusing step [9].
While iCIEF runs are fast, duplicates add up and reactions/degradations can occur prior to sample injection and focusing. The CEInfinite Analytical iCIEF instrument comes with a 96-well plate option for the autosampler that is capable of automated, or on-board, mixing. With on-board mixing, sensitive protein samples and isoelectric focusing (IEF) solutions remain separate in the temperature-controlled autosampler until they are mixed immediately prior to injection into the separation capillary. Less stable proteins are kept well preserved until focusing. Additionally, charge heterogeneity data such as pI or peak area percentage (PAP), is more consistent with automation as variation introduced during manual mixing is circumvented.
All chemical compounds were obtained from Advanced Electrophoresis Solutions Ltd. (AES, Cambridge, Ontario, Canada) unless otherwise specified.
The monoclonal antibody bevacizumab, or ‘mAb’, was received as a gift from Tuopuda Technology Co, Ltd (Beijing, China).
Desalting of the mAb was not required. Undiluted mAb sample (10 mg/mL) was stored at 4ºC. All solutions were prepared with deionised water filtered with a Millipore MilliQ system.
Premixed mAb and IEF solution: 0.25 mg/mL of bevacizumab in 4.0% 3-10 HR AESlytes, 0.35% methyl cellulose, 0.50% 7.05 pI Marker, 0.50% 9.46 pI Marker, 3.00 M urea in deionised water.
mAb dilution for on-board mixing: 2.5 mg/mL of bevacizumab in deionised water.
IEF solution for on-board mixing: 4.4% 3-10 HR AESlytes, 0.39% methyl cellulose, 0.55% 7.05 pI Marker, 0.55% 9.46 pI Marker, 3.33 M urea in deionised water.
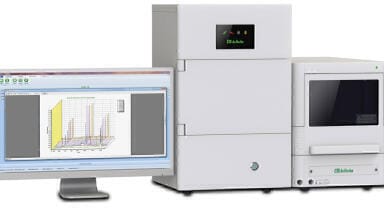
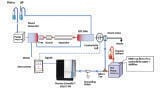
iCIEF was performed using a CEInfinite Analytical iCIEF instrument equipped with an energy-efficient LED UV (280 nm) light source and scientific CMOS camera, eliminating the need for external temperature control for the separation cartridge.
The autosampler sample storage temperature was kept at 10ºC.
25 µL of premixed mAb and IEF solution was injected into the iCIEF cartridge.
45 µL of IEF solution for on-board mixing was aspirated from a glass vial into the autosampler needle. This fluid was then dispensed into a well in a 96-well plate containing 5 µL of 2.5 mg/mL mAb dilution for on-board mixing. The autosampler needle aspirated and expelled the solution twice to mix for a final mAb concentration of 0.25 mg/mL. Immediately after mixing, 25 µL of the total solution was injected into the iCIEF cartridge. Each injection was from an individual mixing event.
Both the premixed and on-board mixed solutions were focused using the same CEInfinite WCID 100 µm ID fluorocarbon-coated (FC) cartridge. All standard
CEInfinite WCID cartridges have a 5 cm separation capillary.
The anolyte was 80 mM phosphoric acid and the catholyte was 100 mM sodium hydroxide. Both solutions were prepared in 0.1% methyl cellulose.
Sample was focused for 1.0 minute at 1.5 kV and then for 7.5 minutes at 3.0 kV. Focused profiles were imaged with 280 nm UV light.
Electropherogram, or charge profile, data was exported from CEInsight software, the operating software for CEInfinite iCIEF instruments.
pI and PAP values were calculated using Clarity (DataApex, Prague, The Czech Republic). For peak integration, the integration interval was ~7.6 to ~8.7 pI, the Global Peak Width was set to 0.100 pI, and the Global Threshold was 0.1000 mAbsorbance. This yielded profiles similar to those in Figure 2 for each mixing method.
The data was tabulated and analysed in Excel (Microsoft, Redmond, WA).
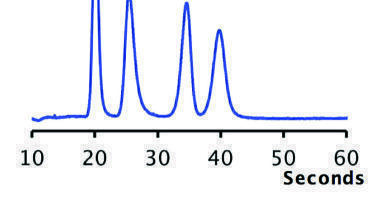
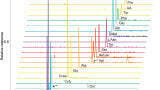
As a baseline for comparison, the mAb was manually prepared to a final concentration of 0.25 mg/mL in IEF solution. To quantify the repeatability of the mAb charge profile, injection of this sample was repeated five times, for six injections total. These six profiles are overlaid in Figure 3 to show the consistency between the injections. The four dominant charge variants of the mAb are labelled in Figure 3: the minor
and major acidic peaks, acidic 1 and acidic 2, respectively; the main peak; and the
basic peak.
To quantify profile consistency, the percent relative standard deviation (% RSD) of both the pI and the PAP was calculated for each of the four charge variants and is displayed in Table 1.
To compare the precision of on-board mixing to manual premixing, the mAb stock was diluted to 2.5 mg/mL, diluted ten-fold in IEF solution, and mixed promptly before injection into the cartridge separation capillary. The mixing and injection process was repeated five times from a total of six different sample wells. These on-board mixed charge profiles are layered in Figure 4 to highlight their consistency across mixing events.
The pI and PAP of the four major charge variant peaks were determined to evaluate the precision of the on-board mixing function. The results are summarised in Table 2.
The automated nature of on-board mixing saves time in the preparation of individual protein samples when compared to manual premixing. For method transfer to this more efficient iCIEF process, there must be a negligible loss of precision in charge heterogeneity profile data. Both the premixing and on-board mixing options for the CEInfinite Analytical instrument were used to measure equivalent solutions of bevacizumab to compare reproducibility, as measured by % RSD. All values for the premixed are in Table 1 and those for the on-board mixed can be found in Table 2.
The results obtained using the CEInfinite instrument will also be compared to a study by Sosic et al. published in Electrophoresis that utilised a comparable iCIEF instrument to study a very similar mAb as evidenced by its peak pI and PAP values [10].
When comparing variation in the pI values for the main mAb peak, the premixed was slightly greater than that seen in on-board mixing (0.03% vs 0.02%). In the Electrophoresis study with the comparable mAb, the main peak pI % RSD was three-fold greater than seen from the CEInfinite (0.1% RSD) [10]. For variation in pI for the main acidic peak, acidic 2, the pI precision was similar between the premixed and the on-board mixed (0.04% vs. 0.05% RSD). This does not outperform the comparable instrument, as the Electrophoresis study reported 0.0% RSD for the main acidic peak [10]. For the minor acidic peak, acidic 1, the pI RSD for the premixed was lower than the on-board mixed (0.02% vs. 0.13% RSD). The earlier work did not calculate the pI for the minor acidic peak [10]. The premixed was outdone by on-board mixing for the basic peak pI (0.11% vs. 0.08% RSD), which was not calculated in Sosic et al. [10].
The % RSD value for the main peak PAPs was 45% higher for the premixed than the on-board mixed on the CEInfinite (1.15% vs. 0.79% RSD), and the RSD for the same peak in Sosic et al. was more than double the CEInfinite values (2.6% RSD) [10]. For the larger of the two acidic charge variant peaks, acidic 2, on-board mixing was over twice as precise when comparing PAP than premixing (1.30% vs. 3.40% RSD). For acidic 1, the minor acidic peak, the % RSD values for PAP where very similar between methods (8.11% vs 8.34% RSD). In the previous study, the PAP for both acidic species were combined to yield an RSD of 6.9% [10]. The on-board mixed % RSD values for basic peak PAP were slightly lower than those for the premixed (10.10% vs. 10.66% RSD) and both values outperformed when compared to the previous Electrophoresis study (17.1% RSD) [10].
Overall, CEInfinite on-board mixing delivered similar or improved precision, as calculated by % RSD, when compared to premixed sample preparation. For those where results were similar, the premixed variability was slightly lower but arguably not enough to compensate for the increased efficiency made possible by on-board mixing.
Where comparable data was available, the CEInfinite surpassed the analogous instrument except for when calculating the pI of the main acidic peak (acidic 2), where the reported % RSD was 0.0% [10]. Though the identity of the mAb in Sosic et al. was not made available, the mAb used in this study was similar enough for method comparison. It is also interesting to note this
outperformance as the Electrophoresis study had twice the sample size (n=12).
Biotherapeutics, including mAbs, continue to gain momentum as an effective medical intervention in a variety of diseases. As biologic production escalates, variations in charge can be introduced with the potential to significantly alter curative efficacy and patient safety. iCIEF is an efficient and robust way to quantify charge heterogeneity in protein therapeutics at any point in development. The CEInfinite Analytical iCIEF instrument from Advanced Electrophoresis Solutions Ltd is equipped with on-board mixing, increasing throughput while maintaining and often improving reproducibility from existing iCIEF methods.
1. G. Galfrè, and C. Milstein. Methods Enzymol. 73 (1981), 3-46.
2. O. H. Brekke, and I. Sandlie. Nat. Rev. Drug Discov. 2 (2003), 52-62.
3. A. Shukla, B. Hubbard, T. Tressel, S. Guhan, and D. Low. J Chromatogr B, 848 (2007), 28–39.
4. R. M. Lewis, and M. E. Cosenza. Regulatory Focus, 16 (2010), 25-29.
5. R. J. Harris. Dev. Biol. 122 (2005), 117-127.
6. P. W. Tebbey, A. Varga, M. Naill, J. Clewell, and J. Venema. MAbs, 7 (2015), 805–11.
7. J. Wu, S. C. Li, and A. Watson. J. Chromatogr. A, 817 (1998), 163-171.
8. Q. Mao, and J. Pawliszyn. J. Biochem. Biophys. Methods, 39 (1999), 93-110.
9. L. Goodridge, C. Goodridge, J. Wu, M. Griffiths, and J. Pawliszyn. Anal. Chem. 76 (2004), 48–52.
10. Z. Sosic, D. Houde, A. Blum, T. Carlage, and Y. Lyubarskaya. Electrophoresis. 29 (2008), 4368-76.