Columns (GC)
Published over 5 years ago. See the latest and most current information on Columns (GC).
Microplastics (MP) are an emerging pollutant which are widely distributed in the environment. Understanding the impact of their growing prevalence on the environment and human health is an important field of research. Analysis of MP in environmental samples is performed using various methods and instruments based either on spectroscopy or thermo-analytical methods combined with chromatographic separations. In this study, the applicability of using Pyrolysis/Thermal Desorption (Py/TD) coupled to single and multi-dimensional Gas Chromatography-Time of Flight Mass Spectrometry (GC(xGC)-TOFMS) as a tool for analysis of MP in environmental samples was evaluated by a series of proof of principle experiments using polymer standards and environmental aerosol samples.
Plastics are synthetic polymers mostly made from petrochemical sources. Starting industrially in the 1950s, the rate of production has been increasing annually. In 2019, around 368 million metric tons of plastics were produced worldwide [1].
Most plastics do not degrade. Instead, they slowly fragment into smaller particles, referred to as microplastics (MP) and nanoplastics (NP) based on the wide variability in size. Microplastics may have complex toxicological consequences for the environment and human health [2], and research activities in this field are increasing. Therefore, reliable analytical strategies for the characterisation of microplastics are needed to inform toxicology studies and extrapolate to environmental exposure.
Fourier-Transform Infrared (FTIR) and Raman spectroscopy are established techniques, which are practically useful for the identification of single microplastic particles. Unfortunately, they have well understood limitations when dealing with polymer-chemical mixtures, small particle sizes, and sample analysis time. The use of Pyrolysis (Py) and Thermal Desorption (TD) in combination with Comprehensive Gas Chromatography (GCxGC) and Time-Of-Flight Mass Spectrometry (TOF-MS) is an alternative tool for MP analysis in environmental samples. This approach requires minimal sample preparation and provides powerful chromatographic separation with high quality deconvoluted mass spectral data allowing for MP degradation products, additives, and other complex mixtures of chemicals found in the environment to be resolved, detected and identified.
In order to demonstrate the feasibility of the selected instrument configuration, a proof of concept study was carried out.
Reference Materials
Nine polymer standards, available in fine powder or granule forms, were used: polystyrene (PS), polyvinylchloride (PVC), polyethylene (PE), polypropylene (PP), poly(bisphenol carbonate) (PC), polyethylene terephthalate (PET), polymethylmethacrylate (PMMA), nylon-6 (N6), and nylon-6,6 (N66) with average molecular weights (Mw) from 25000-35000 g/mol. The granules were mechanically ground using an analytical mill. Approximately 100-200 µg of individual or mixtures of the solid polymers were placed into deactivated micro vials, which were then placed in deactivated inlet liners without any further preparation prior to analysis.
A C7-C40 n-alkane standard was prepared at a concentration of 10mg/L-1 in order to calculate linear retention indices.
Environmental Aerosol Samples
‘PM10, high volume air samplers’, sited by urban road sides in London, UK and in Augsburg, Germany, were used to collect 24-hour samples of particulate matter (and associated chemicals) in aerosols with an aerodynamic diameter of <10 µm onto deactivated quartz filters with a diameter of 47mm and a pore size of 0.8 µm. After sample collection, 4-5mm diameter circular cross sections of the filter were obtained using biopsy punches and transferred to deactivated inlet liners.
Instrumentation and Methods
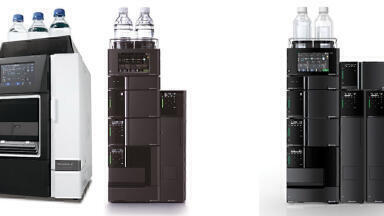
The reference materials and environmental aerosol samples were analysed using a LECO Pegasus® BT 4D system equipped with a thermal modulator and interfaced with an OPTIC-4 injector (GL Sciences BV) The sample liners were either placed manually in the OPTIC inlet or transferred automatically using a liner exchange device (LINEX). The OPTIC inlet was heated rapidly either from 40-250°C at 2°C/sec for thermal desorption analyses or from 50-600°C at 60°C/sec for pyrolysis analyses. Two GC column setups were used for the purposes of this preliminary work, with both using Rxi-5ms (Restek, USA) non-polar primary columns (5% diphenyl / 95% dimethyl polysiloxane), and Rxi-17SilMS (Restek, USA) mid-polar secondary columns (50% phenyl / 50% dimethyl polysiloxane). Combinations used were 30m x 0.25mm x 0.25 µm or 60m x 0.25mm x 0.25 µm in the 1st dimensions and 0.8m x 0.25mm x 0.25 µm or 1.9m x 0.10mm x 0.10 µm in the 2nd dimensions, respectively. With the shorter length column set, GC oven temperature rate parameters were 50-300°C at 10°C/min (hold time 6min) with a 2nd oven offset of 15°C, and for the longer length column set, they were 40-250°C at 2°C/min (hold time 10min) with a 2nd oven offset of 5°C. GCxGC modulation frequencies of 1.5sec and 4.0sec were used respectively. In all cases helium carrier gas at 1.2mL/min in constant flow mode was used with split ratios of between 100 and 200. Representative 1D-GC data were acquired using the installed GCxGC column configurations by simply turning off the modulator. The TOFMS acquisition parameters were set to 12 spectra/sec for 1D analyses or 200 spectra/sec for 2D analyses, collecting full scan mass spectra between m/z 45 and 1000.
The transfer line and ion source temperatures were set to 280°C and 250°C respectively.
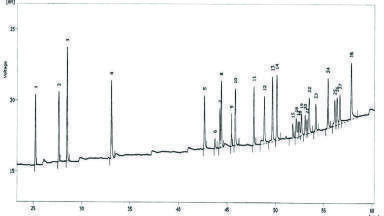
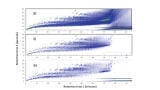
Reference materials were first analysed in 1D in order to create a library of polymer pyrolysis break-down products. The GC-MS data were processed with ChromaTOF® brand software (LECO) that includes deconvolution as part of the automated peak finding feature. Peak areas were calculated with the integration of a single m/z per analyte. Identifications were determined by spectral matching to the NIST library database [3] and additional retention index matching. The acquired pyrograms differ significantly in their complexity and the chemical nature of the polymer degradation products. Four polymers (PS, N6, PC, PMMA) generate simply a large peak of the monomer. An example of styrene and its associated dimer and trimer from polystyrene are shown (Figure 1a). With N66, PET, and PVC, the main breakdown products of the pyrolysis process are small molecules instead of the monomers. For N66 the dominant pyrolyzate is cylopentanone as a degradation product of adipic acid (Figure 1b). In the case of PVC, benzene and hydrochloric acid (not detected with the MS method used) are the degradation products with the highest signal intensities.
Benzoic acid, benzene, and biphenyl are the three main pyrolysis products of PET. The pyrogram of PE shows a series of triplets in the range of C-8-C30 (Figure 1c). The scission process of the PE pyrolysis is well understood and described in the literature [4,5]. During pyrolysis the carbon backbone is broken, producing smaller hydrocarbons with terminal free radicals, which are stabilised either by hydrogen abstraction or beta scission. This process produces hydrocarbon molecules, which are saturated (n-alkanes), have one double bond (α-alkenes), or have a double bond at each end (α, ω -alkadienes). PP shows the most complex pyrogram of all investigated polymers. It degrades into a large number of branched and unsaturated hydrocarbons in the range of C10 to C30.
All pyrograms acquired with the described instrument configuration were compared with accepted literature data [6]. A very good comparability of the data was found.
Table 1 contains the retention indices and the marker ions for characteristic fragments of the different plastics. This database allows us to match markers from reference materials to unknown polymer samples. In the standard ChromaTOF® software, the features, ‘References’ and ‘Target Analyte Finding’ can be used for this purpose.
In order to identify and semi-quantitate the most used plastic polymers in mixtures or co-polymers, a 3rd party software also was tested. The software tool ChromIdent®, (Lablicate GmbH, Hamburg, Germany) [7], applies pattern recognition techniques [8] on pyrolysis data.
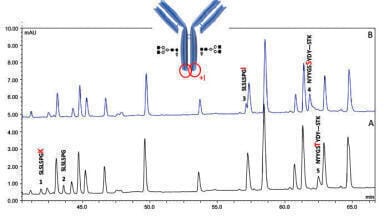
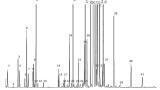
ChromIdent® uses a number of representative peaks (in this example 150) for each of the nine polymer standards to compile a database. This database then can be used to examine blends or copolymers. The software offers two options: either to compare the peak pattern of the sample against a database or directly against another chromatogram. In this study, a polymer mixture has been compared against the peak patterns stored in the database. In summary, 150 peaks from the sample 10 Mix have been queried against the database Microplastics UK. The most abundant peaks, like toluene, styrene, and 1,3,5-triphenyl- cyclohexane, as well as benzene and 2-methyl-naphthalene, can be used as markers for PS and PVC. Small abundant peaks, like fluorene, should also taken into account. In comparison to other techniques, where a combined mass spectrum of the whole chromatogram or of a few selected peaks is created and used for an identification, ChromIdent® performs a deep search on all peaks and the available peak patterns stored in the database. Thus, no prior selection of a few relevant peaks is required, as this is done automatically when compiling the database. Additionally, a retention time shift can be compensated for by using retention indices and the identity mass spectrum as shown in Figure 2. As a result, the plastics PS and PVC can be confirmed as part of the mixture.
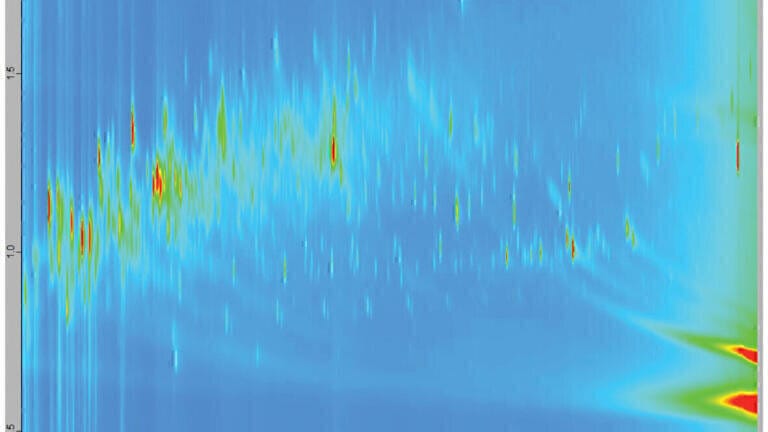
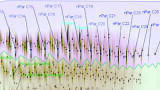
To explore the suitability of GCxGC-TOF-MS for analysis of microplastics in complex environmental samples, 2D analyses of the aerosol filter samples were performed. The 2D contour plot of a pyrolysed filter sample (London, UK) is depicted in Figure 3. 12000 features could be identified with a S/N value of 25. In this complex mixture, PE can be easily and reliably identified as an existing polymer based on its characteristic triplet series (Figures 4a and 4b). Other characteristic polymer pyrolysis products and polymerisation additives could also be detected (Figures 5a and 5b).
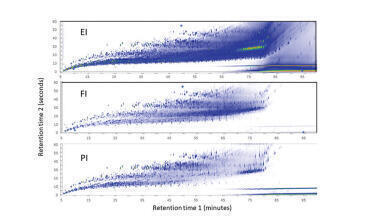
Using GCxGC, a novel 2-step thermal desorption/pyrolysis approach was evaluated. In this regard, 2 measurements of a filter sample (collected in Augsburg, Germany) spiked with a standard of PS were performed. During the first step, thermal desorption conditions were applied in order to introduce the complete volatile and semi volatile compounds to the GC column for a comprehensive analysis without causing degradation to any possible polymers present. Typical patterns for highly complex environmental samples, which contain different chemical species, such as furans, benzols, or 2-ring aromatics, were recognisable (Figure 6a). Furthermore, typical degradation products or additives of polymers, such as α-methylstyrene or diethyl phthalate, could also be identified. Such compounds could not be distinguished from products formed during pyrolysis in a one-step approach. During the second step, pyrolysis conditions were applied to the same, already desorbed filter sample. Characteristic degradation products of PS were found (Figure 6b) and can therefore clearly be assigned to the MP.
In a first step toward detecting environmental microplastic pollution using two-dimensional gas chromatography-mass spectrometry (GCxGC-MS), the applicability of a LECO Pegasus® BT 4D system, equipped with an Optic-4 insert, was tested by analysing common polymer standards. In order to obtain comparable data, the instrument was operated in 1D GC mode. A comparison with literature data shows a very good data consistency.
The 2D analysis of the environmental aerosol samples shows a high number and complexity level of chemical features and the separation, detection, and identification of these is clearly significantly enhanced by the use of GCxGC in combination with the fast acquisition of TOF-MS.
Furthermore, the typical fingerprint of chemicals derived from thermal degradation of plastics in overlap with other compounds from the desorbed matrix, especially in environmental matrices, presents an additional level of complexity, and therefore uncertainty, on whether some chemicals may be potential MP markers or if they could be derived from another source. Due to this, most existing methods involve time-consuming and personnel-intensive purification steps of the sample matrix to isolate and/or concentrate the plastic matrix prior to actual analysis. Therefore, it is possible that the novel two-step desorption/pyrolysis approach described and tested here might overcome this issue. These results pave the way for future studies on the optimisation of two-phase TD/Py-GCxGC-TOF-MS for the analyses of ambient aerosols containing microplastics.
We thank Dr Stephanie Wright, Imperial College London (UK), for providing standards and samples and the valuable discussion during the proof-of-concept phase and Dr David Green (Imperial College London) for providing the samples. Some measurements and conceptual work was performed at the Helmholtz Zentrum München, Cooperation Group: Complex molecular Analytics (CMA).
1. https://www.researchgate.net/publication/337506127
2. Alabi et al., J Toxicol Risk Assess 2019, 5:021
3. Stephen E. Stein, J Am Soc Mass Spectrom 1994,5, 859 -866[4] J.A. Gonzales-Perez, Pyrolysis-gas chromatography-isotope ratio mass spectrometry of polyethylene, J.Chromatogr. A 1388 (2015) 236-243
5. S.C. Moldoveanu, Analytical Pyrolysis of Synthetic Organic Polymers, Elsevier, Amsterdam 2015
6. P.Kusch, Application of Pyrolysis-Gas Chromatography/Mass Spectrometry, Comprehensive Analytical Chemistry December 2016
7. https://lablicate.com
8. Wenig, P. & Odermatt, J. Efficient analysis of Py-GC/MS data by a large scale automatic database approach: An illustration of white pitch identification in pulp and paper industry, Journal of Analytical and Applied Pyrolysis 87, 85–92 (2010)


-(1).jpg)