Bioanalytical
Published over 8 years ago. See the latest and most current information on Bioanalytical.
Volatile organic compounds are used in pharmaceutical manufacturing during the production of drug substances, pharmaceutical additives, and drug products. Known also as residual solvents, they account for 50-90% of mass in typical pharmaceutical operations and represent most of the process toxicity[1]. These organic solvents can contaminate the drug product during its packaging, storage, and transportation. Testing for the presence of these solvents in Active Pharmaceutical Ingredients (API) is critical for patient safety and commonly follows Unites States Pharmacopeia (USP) Method <467> guidelines, or more broadly, International Council for Harmonisation (ICH) Guideline Q3C(R6).
USP Method <467> recommends a 60-minute gas chromatography (GC) runtime for residual solvent analysis[2]. Class 1 and 2 solvents are additionally suggested to be analysed separately. VUV Analytics recently published an application note describing how the spectral deconvolution capabilities of VUV spectroscopy allow GC runtimes to be shortened from 60 minutes to 10 minutes or less[3]. Solvent classes can also be combined into individual analyses for increased sample throughput.
GC-VUV spectral data is inherently three dimensional (time, absorbance, wavelength) and specific to compound chemical structure. Most compounds absorb strongly in the VUV region (120 – 240 nm) of the UV spectrum measured by VUV detection. Photons in this wavelength range are capable of producing electronic transitions in virtually all chemical bonds, especially in ground state to excited state transitions such as σ→σ* and π→π*. The result is spectral signatures that are specific to each compound and can be readily identified by the VUV library[4]. This characteristic of VUV spectroscopy lends itself to intentional chromatographic compression due to the ability to deconvolve overlapping spectral responses.
A GC-VUV method that utilises static headspace sampling was developed for the analysis of all residual solvent classes (Class 1 – 3) in addition to other solvents of interest. Significant gains in analysis productivity can be realised by decreasing total GC runtimes by greater than 5X. This capability is demonstrated here by condensing the runtime used in Class 3 residual solvent analysis. The GC-VUV method is also especially adept at identifying untargeted unknown analytes in pharmaceutical samples. An example is provided where an unexpected compound was detected in an over-the-counter hangover relief medication.
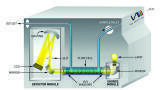
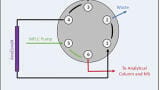
GC-VUV analysis was completed with the following setup:
Detector: VUV Analytics VGA-100
Static Headspace Sampler: GERSTEL MPS2
Gas Chromatograph: Agilent 6890
Column: Restek 30m x 0.25mm x 1.40µm Rxi- 624Sil MS
Experimental conditions for the gas chromatograph, static headspace sampler, and detector are provided below.
An Agilent 6890 gas chromatograph was used with the injection port set to 250°C. A helium carrier gas flow rate of 4 mL / min was used throughout the experiment. The oven profile for the residual solvent analysis began at 35°C (held for 1 min), followed by an increase to 245°C at a rate of 30°C/min. A split ratio of 2.5 was utilised to help maximise sensitivity. A total GC runtime of 8 minutes was programmed for each sample analysed.
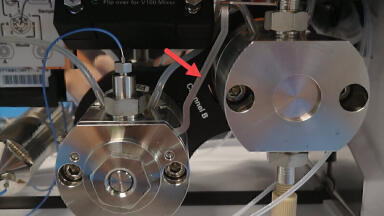
A GERSTEL Multi-Purpose Sampler (MPS) was used to provide optimal temperature and injection setting automation and the most efficient delivery of residual solvent samples to the GC. The syringe temperature was held constant at 90°C. An incubation temperature of 80°C was set to best volatilise residual solvents while not going above the boiling point of water. The incubation time was set to 10 min to closely match the GC run time of 8 min. An injection volume of 250 µL was selected to ensure good peak shape. The agitator was 250 rpm (10 sec on, 1 sec off), and an injection speed of 200 µL/sec was used for sample introduction.
A VGA-100 gas chromatography detector manufactured by VUV Analytics was used in this experiment. The transfer line & flow cell temperatures were set at 275°C. The makeup gas pressure used was approximately 0.36 psi. An acquisition range of 120 to 240 nm was selected with an acquisition speed of 4.5 spectra/sec.
Testing for residual solvents in pharmaceutical products and excipients is mandated by ICH Q3C(R6) guidelines because of their known toxicity and potential effects on the environment[5]. Class 1 compounds are generally discouraged from use in the manufacture of drug substances, excipients, and drug products. They are classified in the most restrictive category due to the compounds being known human carcinogens, strongly suspected human carcinogens, or environmental hazards. Table 1 shows the five compounds with the highest risk of use from a regulatory standpoint. Their permitted daily exposure (PDE) concentration limits are given in units of ppm.
Table 1: Class 1 residual solvents given with their ICH permitted daily exposure (PDE) concentration limits. These compounds are discouraged from use in manufacture of drug substances, excipients, and drug products because of their unacceptable toxicity or their impact to the environment.
The category Class 2 indicates that the use of these solvents should be limited because of they are non-genotoxic animal carcinogens and suspected to be causative agents of irreversible toxicity such as neurotoxicity or teratogenicity. The available data also indicates that other significant but reversible toxicities can result from exposure to the compounds. Table 2 shows the wide range of PDE concentration limits of Class 2 solvents. Analysing the lowest and highest concentrations on a single GC run requires a wide linear range. It has been demonstrated previously that VUV spectroscopy is capable of analysing samples across such a broad concentration spectrum[3].
Table 2: Class 2 residual solvents given with their ICH permitted daily exposure (PDE) concentration limits. The VGA-100 VUV detector provides the linear range required to analyse all the compounds together in a single GC run.
Class 3 solvents have low-risk of toxicity and are not considered human health hazards at concentrations normally accepted in pharmaceutical products. The general guideline provided by ICH Q3C(R6) is to limit them to 50 mg / day, or 5000 ppm. Exceptions to the recommended PDEs can be granted if the concentrations are realistic in relation to manufacturing capability and good manufacturing practice. A list of Class 3 solvents is provided in Table 3. An example will be shown where these compounds have been injected at 0.5X the PDE limit using a fast GC-VUV and static headspace method to reduce the total GC runtime to less than eight minutes.
Table 3: Class 3 residual solvents. Data available when ICH Q3C(R6) was published indicated that the compounds are less toxic in acute or short-term studies and negative in genotoxicity studies. The recommended PDE concentration of these compounds is 5000 ppm.
Class 3 Residual Solvent Analysis
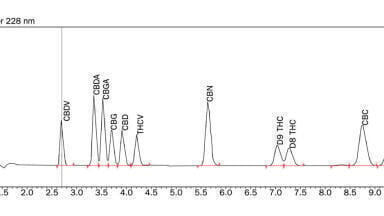
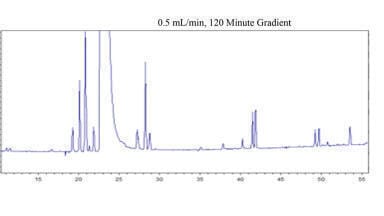
It has been shown that Class 1 and 2 residual solvents can be analysed together in a compressed chromatographic analysis[3]. The GC-VUV and static headspace method was applied to Class 3 residual solvents to further demonstrate its utility across all solvent classes and types. A sample was prepared by mixing 2-mL of water with 50 mg of generic throat spray and spiking a Class 3 Solvent Mix (Restek) at 0.5X the ICH Q3C(R6) PDE concentration limit. The total GC runtime was set to 8 minutes as described in the Experimental section. Figure 1 shows the GC-VUV chromatogram of these Class 3 solvents. n-Butanol was the last analyte to elute in the chromatogram and had a retention time of less than 4 minutes. All Class 3 solvent analytes were unambiguously identified despite the shorter separation time.
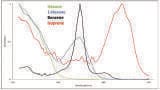
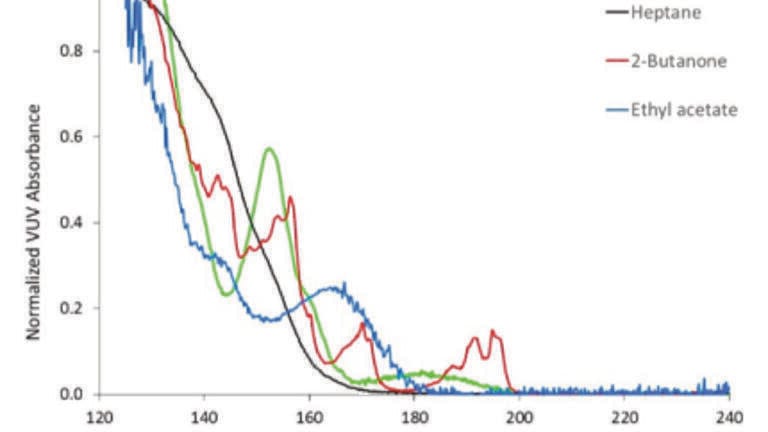
High-energy, short wavelength light in VUV portion of the ultraviolet spectrum creates unique spectral “fingerprints” for most compounds. This characteristic is demonstrated in the spectral overlay of selected Class 3 solvents shown in Figure 2. The co-eluting analytes 2-butanone and ethyl acetate have distinct spectra that provide for straightforward identification and chromatographic peak deconvolution[6,7]. VUV software provides the necessary interface for matching analyte spectra with compounds in the VUV library. Goodness of fit statistics ensure that correct compound identification takes place during post-run data analysis.
One of the unique capabilities of the VUV spectroscopy is the ability to compress chromatography and utilise spectral deconvolution during post-run analysis. Co-eluting analyte spectra can be reliably matched with compounds in the VUV library, and VUV software algorithms reconstruct their chromatographic peaks based on the wavelength, absorption, and time data collected during the GC run. Figure 3 shows the reconstructed chromatogram peaks of 2-butanone and ethyl acetate that reflect their relative abundance in the sample6. GC-VUV data quality does not deteriorate when compound separation is incomplete.
Early experiments using the GC-VUV and static headspace residual solvent analysis method involved spiking standards into pharmaceutical products to demonstrate their detectability. There was also interest in finding residual solvents in unadulterated medication. A range of over-the-counter medications were tested including herbal supplements, headache medicine, throat spray, and allergy pills. The majority of products analysed were negative for the presence of residual solvents. This is an excellent outcome for consumers but quite disappointing from a scientific curiosity point of view. One unexpected result was observed when characterising hangover medication. A brand advertised to provide instant relief showed a large unknown peak when 2 mL was injected neat into the GC. This peak can be seen at the 1.75-minute mark in the GC-VUV chromatogram in Figure 4. Spectral filters were applied during post-run analysis to visualise the absorbance characteristics of the analyte.
Figure 4: GC-VUV chromatogram of an over the counter hangover remedy. The fast GC-VUV and static headspace method for residual solvents analysis resulted in an unknown analyte peak that was later identified using spectral matching.
An important aspect of VUV spectroscopy is its ability to unambiguously identify compounds by their absorbance spectra. Analyte absorbance matched against VUV library spectra provides a clear picture of compound identity when comparing the fitting statistics during data analysis. The unknown analyte in the aforementioned hangover medication had a strong statistical fit with the ethyl alcohol spectrum in the VUV library. Figure 5 shows the complete spectral overlap of library and analyte spectra. The identity of ethanol was confirmed further by the R2 fit of 0.997 and zero-residual value displayed in the window above the spectral overlay. The makers of the hangover medication in question clearly referred back to ancient “hair of the dog” wisdom when deciding on its most active ingredient.
Figure 5: Fitting the unknown analyte in hangover medication with compounds in the VUV library. An R2 of 0.997 (inset image) results when the analyte is fit with ethyl alcohol. The flat line above the spectral fitting window shows a zero-residual value, indicating a strong match of the untargeted unknown with ethanol.
Solvents used in the manufacture of pharmaceutical products and excipients range in their toxicity and concentration limit requirements. GC-VUV and static headspace has been demonstrated to be suitable for the analysis of Class 1 – 3 residual solvents, and others of interest. GC runtimes can be significantly reduced (>5X) from those recommended by the USP <467> protocol. The unique spectral features of compounds analysed in the VUV spectrum enable straightforward deconvolution of co-eluting analytes in compressed chromatograms. Further throughput gains can be achieved by utilising the wide linear range of VUV spectroscopy to combine different solvent classes into the same run. Untargeted unknowns in API can be easily identified by matching analyte spectra with VUV library compounds. GC-VUV and static headspace provides a single method for the identification and quantitation of toxic solvents in pharmaceutical products.
For more detailed information please visit our website at www.vuvanalytics.com, or contact us at [email protected].
Special thanks to Jack Cochran, Sr. Director of Applications, and Lindsey Shear-Laude, Applications Scientist at VUV Analytics, Inc., for their work in developing this GC-VUV method.
1. http://igss.wdfiles.com/local--files/kundai-marimira/KM_Solvents-web.pdf
2. USP 32–NF 27, General Chapter <467> Organic volatile impurities, Unites States Pharmacopeia. Pharmacopeia Convention, Inc., Rockville, MD, 8/2009
3. The Analysis of Residual Solvents in Pharmaceutical Products Using GC-VUV and Static Headspace, Application Note VUV100-0007EN, VUV Analytics, Inc.
4. K.A. Schug, I. Sawicki, D.D. Carlton, H. Fan, H.M. McNair, J.P. Nimmo, P. Kroll, J. Smuts, P. Walsh, D. Harrison, Vacuum ultraviolet detector for gas chromatography, Anal. Chem. 86 (2014) 8329–8335
5. ICH Harmonized Guideline, Impurities: Guideline for Residual Solvents Q3C(R6), Step 4 version, October 20, 2016
6. Deconvolution of Co-Eluting Chromatographic Signals through Vacuum Ultraviolet Spectroscopy, Application Note VUV100-0002EN, VUV Analytics, Inc.
7. K.A. Schug, M. Garbalena, P. Walsh, Rapid Analysis and Time Interval Deconvolution for Comprehensive Fuel Compound Group Classification and Speciation Using Gas Chromatography−Vacuum Ultraviolet Spectroscopy, Anal. Chem. 2016, 88, 11130−1113