Bioanalytical
Published over 4 years ago. See the latest and most current information on Bioanalytical.
Cannabinoid is a generic term for the chemical substances contained in cannabis plants. Tetrahydrocannabinol (THC), cannabinol (CBN), and cannabidiol (CBD) are major components. THC is highly psychoactive and since 1970 has been classified as a schedule 1 drug in the US. Currently marijuana has been legalised for medicinal and recreational use in various countries around the world [1].
CBD has shown possible treatment effects for various disease states such as Alzheimer’s [2], Parkinson’s [3], psychosis and depression [4], as well as an effective remedy for pain due to its anti-inflammatory properties [5]. This compound doesn’t cause any psychological effects and therefore is not subject to abuse or physical/psychological dependence. CBD is not regulated by international regulations and products have already been approved as effective medicines for refractory epilepsy in the United States. In the Cannabis Control Law of Japan, the use of leaves, flowers, and roots from cannabis plants is banned as those parts contain a significant amount of THC. Seeds and stems are not regulated so development of CBD products extracted from these parts are legal.
Although CBD oil (for relaxation effect) and cream (for inflammation suppression and moisturising effect) are distributed in the market as health foods and beauty products, the concentrations of CBD vary significantly depending on the product. In addition, studies [6] have shown that THC was detected in some CBD oils, therefore it is important to establish an analytical method for quality control of these products. It is known that CBD changes to THC and its stereoisomers under acid conditions. CBD exists as a (-)CBD enantiomer in nature, but recent reports [6] have shown that the (+)form is more effective as an anticonvulsant than its counterpart. In this article an analytical method was developed for various cannabinoids in CBD products using Supercritical fluid chromatography (SFC) system with a mass spectrometer (MS) and circular dichroism (CD) detectors. The combination of MS and CD detectors allows for universal detection for cannabinoids and specific detection for their stereoisomers.
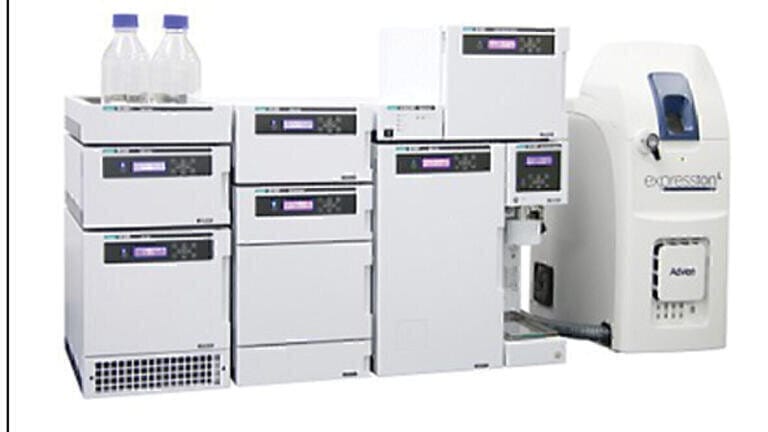
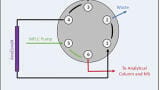
Figure 1 shows the layout and schematic diagram of JASCO SFC-CD-MS system. In this experiment a photodiode array (PDA) detector was added upstream of the CD detector. This system enables the method scouting analysis for determination of the best mobile phase and column combination. A switching valve was added before the CD detector to allow for stopped flow spectral scanning.
CBD standard was purchased from Cayman Chemicals and other cannabinoid standards were purchased from Sigma-Aldrich (Figure 2). CBD, CBDV, and CBDA standards were enantiomers. A commercial CBD oil was obtained from an online store. The CBD concentration on the label was 0.4%.
Sample: Cannabinoid’s mixture in methanol (100 µg/mL each)
Injection: 5 µL
Flow Rate: 3.0 mL/min
Isocratic: 80% CO2, 20% Co-solvent (50% Acetonitrile/ 50% Methanol)
PDA Wavelengths: 200-400 nm
CD Wavelength: 230 nm
Back Pressure: 150 bar
Column
Temperature: 40°C
Columns: 4.6 mm I.D. x 250 mmL,
5 µm
1. SFCpak SIL-5
2. SFCpak DIOL-5
3. SFCpak NH2-5
4. SFCpak C18T-5
5. 2-Ethylpyridine
6. 4-Ethylpyridine
7. InertSustain Amide
8. InertSustain Cyano
9. InertSustain Phenyl
(1-4 from JASCO, 5-6 from Princeton
Chromatography, 7-9 from GL Sciences)
MS Parameters: Ion Source: APCI Polarity: Positive Measurement Mode: Scan
Mass Range: 100-600m/z Source span: 0 Capillary Temp: 200°C Capillary Voltage: 160V Source Offset: 30 Gas Temp: 350°C
Corona Discharge: 5µA
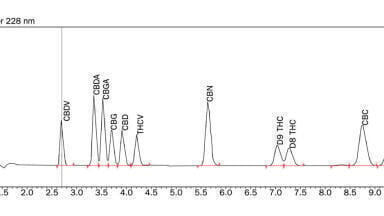
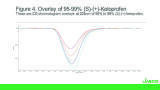
From the results of the method scouting the Amide column showed the best potential for further optimisation with a crude separation of CBG (peak 2) and CBDA (peak 3) from CBD, CBDV and CBN (peak 1) as shown in Figure 3. In order to improve the separation of cannabinoids, two amide columns were connected in tandem and gradient elution of the modifier was employed. Figure 4 shows the result of the best separation of the cannabinoid standard (TIC). These separation conditions were used in the following experiments.
Figure 5 shows the chromatogram and spectra of cannabinoid standard mixture (200 µg/mL each) obtained by PDA, CD, and MS detectors. The CBD and CBDV had similar pattern in UV spectra (Figure 5-1C). CBD, CBDV, and CBDA standards had (-) CD polarity at 230 nm (Figure 5-2A) and we obtained their CD spectra with good shape and enough intensity (Figure 5-2C). Mass spectra of cannabinoids were observed at m/z 315.5 (CBD, [M+H]+), 287.4 (CBDV, [M+H]+), 311.4 (CBN, [M+H]+), 193.2 (CBG, fragment ion), and 341.4 (CBDA, [M-H2O+H]+), respectively (Figure 5-3B).
The CBD oil was diluted 10 times with methanol and the results from the analysis obtained by PDA, CD, and MS are shown in Figure 6. Peak 2 on the UV chromatogram (Figure 6-1-A) was identified as CBD by comparing it to the standard spectrum (Figure 6-1-C). Peak 1, which was co-eluting with peak 2, wasn’t corresponding to the CBD spectra. Peak 3 and 4 that were assumed to CBDV and CBG from their retention time weren’t corresponding to standard UV spectra due to their much lower intensity. Although CBD in CBD oil was detected as (-) CD polarity, the UV spectrum wasn’t same as the CBD standard due to the co-eluting unknown peak (Figure 6-2-A and C). CBD, CBDV, CBN, and CBG were detected selectively on XICs at much lower concentrations. However, co-eluting unknown peaks were detected on m/z 315.5 and 287.4 of XICs. These unknown peaks can be estimated to other cannabinoids that have similar molecular weights and were not prepared in this experiment (ex. 314.46 g/mol of THC and 314.47 g/mol of cannabichromene for m/z 315.5, 286.41 g/mol of tetrahydrocannabidivarin for m/z 287.4).
The SIM (Single Ion Monitoring) chromatograms at each m/z of CBD oil, diluted 50 or 20 times with methanol, is shown in Figure 7. Table 1 shows the linearity, reproducibility of retention time and peak area, detection limit of cannabinoids and their concentration in CBD oil all of which performed quite well. Experimental CBD concentration in CBD oil corresponded to the label claim of 0.4%. Several cannabinoids were included in this oil.
SFC with PDA, CD, and MS detectors enabled comprehensive identification of the chiral/achiral cannabinoids in CBD oils. It has been confirmed that CBD in CBD oil existed as an enantiomer and detected as (-) CD polarity at 230 nm. SIM detection by the MS detector provided high linearity, reproducibility, and sensitivity for cannabinoid analysis in CBD oil. Further improvement of the separation is needed due to the presence of other cannabinoids with similar retention times and molecular weights.
1. Simpson, Victoria (2020, May 27) Society. Countries Where Cannabis is Legal. https://www.worldatlas.com/articles/countries-where-cannabis-is-legal.html
2. Alzheimer’s Society. (n.d.) Cannabis, CBD Oil and Dementia. https://www.alzheimers.org.uk/about-dementia/treatments/alternative-therapies/cannabis-cbd-oil-and-dementia
3. Gilbert, Rebecca. (n.d.) American Parkinson Disease Association. Use of Cannabidiol (CBD) for PD Symptoms. https://www.apdaparkinson.org/article/cannabidiol-and-parkinsons-disease/
4. Medicinal News Today. (2019, April 1) Can CBD Help Treat Depression? https://www.medicalnewstoday.com/articles/324846
5. Medicinal News Today. (2020, November 3) Does CBD Oil Work for Chronic Pain Management? https://www.medicalnewstoday.com/articles/319475#what-is-cbd-oil
6. Expert Committee on Drug Dependence Thirty-ninth Meeting. Cannabidiol Pre-Review Report (World Health Organization, Geneva, 2017)


-(1).jpg)