
Supercritical fluid (SFC), green chromatography
Published over 11 years ago. See the latest and most current information on Supercritical fluid (SFC), green chromatography.
A supercritical fluid chromatograph (SFC) was interfaced to a quadrupole time-of- flight (Q-TOF) mass spectrometer, with an electrospray (ESI) source, operated in positive ion mode, which was use to separate complex mixtures of glycerides in a fish oil using several different SB C18 columns with methanol, doped with 5 mM ammonium acetate in carbon dioxide. A ~10:1 post column split, through a 1 meter long 50 µm stainless steel restrictor, with a make-up flow of pure methanol, was used as an interface. Other constituents found included various terpenoids, flavonoids, free fatty acids, phospholipids, and a number of Vitamin D3 precursors.
The samples were diluted with isopropyl alcohol and injected. Plots of mass vs retention time show almost no overlap, while resolving up to 400 components in either time or mass in as little as 7 minutes. Sensitivity was enhanced over 1000 fold compared to UV at 230 nm. Up to half the resolved components were assigned names using several lipid databases and absolute mass. Partition number (PN) was found to be a poor indicator of elution order.
Introduction
Triacylglycerols (TAG’s) or triglycerides are major constituents of fats and oils. They consist of a glycerol backbone esterified with three fatty acids usually with 10 to 24 carbons each. The TAG content of most oils is complex, although fish oils are generally more complex than vegetable oils, and contain a large amount of polyunsaturated fatty acids. Detailed analysis of seed and fish oils is difficult, due to the large possible variation in the carbon number of the fatty acids at each position on the glycerol backbone, and the possible number, and location, of double bonds on each fatty acid. Many hundreds of variations are possible.
Most recent TAG analyses have been performed by either non-aqueous reversed phase high performance liquid chromatography (narHPLC) with a C18 stationary phase [1], or silver ion liquid chromatography [2], with complimentary retention mechanisms. On C18, the partition number (PN) or elution order is said to be related to the carbon number (CN) minus two times the number of double bonds (2 x #DB) [1]. The mobile phase usually includes acetonitrile-dichloromethane mixtures, both of which are undesirable environmentally. With a silver loaded column, the separation is based on the number of double bonds present. Both approaches have also been performed with supercritical fluid chromatography (SFC) [3-6].
Due to the complexity of such samples, two dimensional, or ‘comprehensive’ HPLC methods have been developed [7] where one dimension separates the TAG’s based on the number of double bonds (silver loaded column), while the second (non-aqueous rHPLC with C18) separates based at least partly on carbon number. A variant has been demonstrated using packed column SFC with carbon dioxide (CO2) and a silver loaded column as the first dimension [8], but with a non-aqueous reversed phase HPLC second dimension.
An alternate HPLC approach [9] to try to achieve higher resolution, involved connecting four C18, 2.7 µm porous shell particle columns in series, and operating at very high inlet pressures. Run times sometimes exceeded 3 hours, but resolution was still incomplete. This development was anticipated in SFC where 7- 12 cm columns in series, with 5 µm particles, were used to chromatograph TAG’s in 1996 [10], and more recently with 5- 2.7 µm porous shell columns [11] with a total length of 75 cm, producing >110,000 plates.
Purely chromatographic techniques are inadequate to fully resolve all the TAG’s. An attractive alternative employs mass spectrometric detection, which can greatly improve the amount of information generated even with a relatively short column. Many different forms of SFC-MS have been used for lipid analysis [6,12-15]. However, there have been few reports on the interfacing of a quadrupole-time of flight (Q-ToF) MS in SFC [17-19]. In the first such report [17] flow was split using 10 meters of 100 µm fused silica between a tee mounted after the UV detector and the MS source as the splitter. More recently, di- and triglycerides in cow milk were characterised, but the interface [18] was not described.
There appear to be only a few older literature references to the use of SFC for the analysis of TAG’s specifically in fish oil. Several [19-21] used capillary columns with pressure programmed CO2 and a FID. It was thought that all TAG’s with the same CN co-eluted from a capillary column, regardless of the degree of un-saturation. Others used a silver loaded packed column [5,8].
In the present work, SFC-Q-TOF MS was used for the qualitative analysis of TAG’s in fish oil, using several simple interfaces to improve resolution, over-all speed, and sensitivity.
Instrumentation and Conditions
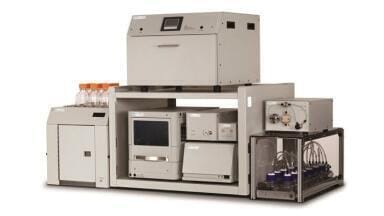
An Agilent Technologies Model 1260 supercritical fluid chromatograph (SFC)
with an Agilent Technologies Model 6540 UHD Accurate Mass Q-ToF with a Dual AJS ESI source was used to analyse the samples. Gas temperature was 325°C, with a drying gas flow of 10 L/min. The nebuliser pressure was 25 psi. The sheath gas temperature was 400°C with a sheath flow of 12 L/min. Capillary voltage was 3500 V at 5.060 µA. The fragmentor voltage was 165 V. The skimmer voltage was 45 V. The OCT1RFVpp was 750 V. The reference mass was 922.0098 (hexakis (1H,1H,3H-tetrafluoro-pentaoxy) phosphazene (C18H18O6N3P3F24)). The source was used in the positive ion mode. The system was controlled by Agilent Technologies MassHunter software. Several in-house lipid data bases were used to put tentative names on many of the compounds separated.
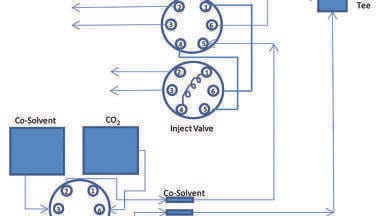
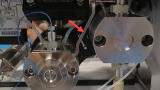
An Agilent Model 1290 make-up pump, delivered 0.5 ml/min methanol after the column, through a tee. Another “tee”, downstream of the make-up flow, split the flow between the back pressure regulator (BPR) and the Q-ToF. One metre of 50 µm stainless steel capillary mounted between the second tee and the needle of the ESI source was used as a ~10:1 split. No external heater was used. In some cases an ultra low volume experimental BPR was used to directly couple the outlet of the SFC to the MS source with no split.
Materials
The columns were either a 4.6 x 150 mm, SB300 C18, with 3.5 µm particles or a 3 x 100 SB C18, with 1.8 µm particles. The carbon dioxide used was ‘bone-dry’ grade in a 50 pound steel cylinder, purchased from AirGas. Methanol and isopropanol were HPLC grade, purchased from VRW. Standards and ammonium acetate were >99% pure, and were purchased from Sigma-Aldrich, St. Louis, MO.
The fish oil was purchased at a local drug store as a commercial dietary supplement in gel capsules. The oil was removed from the capsule with a syringe, then diluted either 100:1 or 1000:1 with isopropyl alcohol then injected directly.
Chromatographic Method
Most of the results were obtained with the 4.6 x 150 mm SB300 C18, 3.5 µm column with 3% (v/v) [MeOH + NH4COOH], held for 5.5 minutes, to 60% (v/v) at 11 minutes, then held for 1 minute. Flow rate was 3 mL/min, column temperature was 60°C, and the outlet pressure was 140 bar. The injection volume was 2 µL. The DAD was set to 230 nm, with a 16 nm bandwidth and slit. Some results were obtained with as little as 0.5% modifier, where noted. Some results were obtained using the 3 x 100 mm, 1.8 µm, SB C18 column at 2 ml/min, 40°C and 140 bar outlet pressure.
Results and Discussion
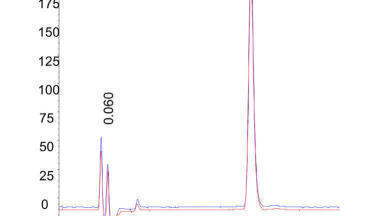
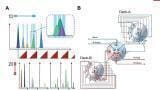
A chromatogram of the fish oil obtained with the 3 x 100mm, 1.8 µm column is shown in Figure 1. This chromatogram superficially resembles chromatograms collected 20 years earlier [21] using a capillary column, with pressure programming, and FID detection. However, the older chromatogram took 2 hrs to collect. Here, the separation is nearly 10 times faster. Total run time was 20 minutes but all sample components were eluted in <15 minutes.
Each colour represents a different mass. Thus, there are many co-elutions. With all filters removed, the MassHunter software identified nearly 2000 unique masses. Filtering out the minor components produced the chromatogram in Figure 1, which represents approximately 400 unique masses. The data were compared to several in-house lipid libraries. The software assigns a ‘score’ which is essentially a degree of fit. Scores greater than 90-95 are considered very good matches. Approximately one third of the unique masses were assigned specific names based on absolute mass alone.
Similar data, but collected with the SB300 C18 column, was better visualised qualitatively by plotting mass vs. retention time, as shown in Figure 2. The size of each dot represents the magnitude of the peak area. With this lower surface area column, retention times were shorter, and there was less chromatographic resolution compared to Figure 1. At this scale, the individual components of the oil still appear to strongly overlap. However, expanding the scale shows remarkably few overlaps, as shown in the insert.
The software allowed the data to be sorted according to functionality. Only triglycerides with a threshold greater than 15,000 area counts, were extracted out of the raw data. Over 140 different unique masses were assigned names as triglycerides. Masses were between approx. 700 and 1200 Da. All compounds eluted between 2.5 to 7 minutes.
On C18 columns, elution order is roughly related to molecular weight. In addition to the TAG’s, 42 diglycerides (DAG’s) were also identified, which eluted in a fairly narrow band from 1.1 to 2.0 minutes, before the TAG’s. This contrasts with another report [18] using a polar ethylpyridine column where the diglycerides eluted after the TAG’s. Interestingly, a small number of Vitamin D3 precursors, phospholipids, free fatty acids, flavonoids, terpenoids from C10 through C30, and even Cofactor Q10, were also named.
Chromatographic Resolution
The resolution between four closely related standards: linoline, linoelaidin, alpha- linolenin, and gamma-linolenin, all with 57 carbons, 6 oxygens, and either 92 or 98 hydrogens were evaluated chromatographically, using the experimental BPR, with no split. The first 2 standards differ only in the position of one double bond on each of the 3 fatty acid chains (6,9,12 vs 9,12,15). The second pair differ in that in one of the pair the double bonds are all cis-, while on the other, they are all trans-. They were separated with the 3 x 100mm 1.8 µm SB C18 column at 2 mL/min, 40°C, 140 bar outlet pressure. Modifier concentration was held at 0.5% (v/v) for 0.5min then ramped to 5% (v/v) at 10 minutes. The results, shown in Figure 3 demonstrate good peak shapes and baseline resolution between both pairs. Modifier concentration was ~3% for the first pair, and near 4% for the second pair. These are fairly remarkable separations based on the similarity of the structures.
Elution Order
The carbon numbers (CN) of many of the named peaks were plotted vs. retention time, as shown in Figure 4. Clearly retention is not proportional to CN. On C18, PN, is purported to be roughly proportional to the CN – 2 x #DB [1]. A plot, shown in Figure 5, reveals virtually no correlation between retention time and PN. Sandra, in an Agilent application note [22], proposed a slightly different equation where PN = CN - #DB which yielded a slightly better, but still poor correlation as shown in Figure 6. At any given retention time, the PN varied by at least 3 units, with outliers > 5. Thus, neither version of PN is very accurate in predicting elution order, at least with fish oils.
Many compounds with the same CN but different #DB were named by the software. In the most extreme case, 9 different compounds were identified with the same CN, but with 6 to 16 double bonds. A plot of retention time vs. #DB for each CN is presented in Figure 7. The vertical line, marked with an A, crosses lines C57 through C67, indicating many compounds with large differences in molecular weight, but with various degrees of un-saturation, co-elute. The horizontal line marked B, indicates the relative retention of all the compounds with #DB = 6, but with various CN. Only with the same #DB, is retention a strong function of CN.
The software data bases reported the number of double bonds on each of the three fatty acids. For example, C63 contained 3 different kinds of substitution. In one group, the third fatty acid (stem name or sn =3) contained a variable number of double bonds on a C22 fatty acid (C22:X, where X represents the variable number of double bonds), while the first fatty acid (sn = 1) was always 16:0 (16 carbons with no double bonds), and the second fatty acid (sn = 2) was always 22:0 (22 carbons with no double bonds). In another group, the third fatty acid was fixed at 22:6, the first fatty acid was fixed at 16:0, while the middle fatty acid contained a variable number of double bonds, C22:X. In the third kind of substitution all three fatty acids were C20. A more detailed plot of this data is presented in Figure 8. Despite a minor deviation by the 20:X (sn = 1) triglycerides, the data produce a surprisingly straight line. Thus, both the chain lengths and location of double bonds varied over a fairly wide range, yet retention appears to be almost completely due to the total number of double bonds, not their location.
Odd CN Fatty Acids
Almost all the TIG’s assigned a name contained fatty acids with an even number of total carbon atoms, usually between C16 and C22. Among the named peaks, with high scores, only 5 triglyceride families had an even carbon number, meaning at least one of the fatty acids contained an odd number of carbons (since the glyceride backbone contains 3 carbons). All 5 were between C54 and C64. In all cases, the odd fatty acid was a C17, with various numbers of double bonds. Most were located at the sn =1 position but a few had the C17 at the sn = 2 position.
Area vs. CN
The areas of all the named triglyceride peaks with the same carbon number were added together and the over-all percentage at each carbon number calculated. The results, presented in Figure 9, indicate that the most abundant carbon number was C63, with a Gaussian-like distribution at higher and lower CN, except for an outlier at C53. Such a distribution resembles the proposed distribution using capillary columns and pure CO2. Mollerup [20,21] found C59 or C61 to be the most abundant TAG in various marine oils from 7 different species. However, Figure 9 represents actual carbon numbers vs. abundance and not retention time vs. abundance.
Summary
The QToF detector resolved at least 10 times and perhaps 100 times more components than the SFC chromatography alone, with minimal overlaps, in minimal time. It appears this approach is adequate to almost completely characterise the lipid content of complex mixtures such as a fish oil. The combination of SFC with a QTOF creates a new level of performance in the analysis of TAG’s. However, the wealth of information from a few repetitive runs can require weeks of further processing and analysis. Such data overload requires a carefully designed analytical plan to collect only the specific information of interest.
The number of discrete compounds found was very large, yet the software was able to identify a large fraction of the components. The combined SFC-QTOF has roughly 100 times higher resolution, with >>1000 times higher sensitivity compared to SFC-UV for these solutes. Absolute mass determinations go a long way toward definitively naming many of the components. The ease of interfacing and the high speed of separation makes SFC highly desirable for such separations. Partition number was found to be a poor indicator of elution order using two different approaches.
References
1]. A. H. El-Handy, E.G. Perkins, 1981 JAOCS, 58, 868-872.
2].G. Dobson, W.W. Christie, B. Nikolova-Damyanova, (1995) J. Chromatogr. B, 671 197-222.
3]. E. Lesellier and A. Tchapla, “Subcritical Fluid Chromatography with Organic Modifiers on Octadecyl Packed Columns: Recent Developments for the Analysis of High Molecular Organic Compounds” , in Supercritical Fluid Chromatography with Packed Columns, K. Anton, C. Berger, Eds. Chromatographic Science Series Volume 75, Marcel Dekker, New York, 1990, Chapter 7, p 213.
4]. E. Lesellier, A. Tchapla, (2000) Chromatographia, 51, 688-694
5]. L.G. Blomberg, M. Demirbuker and P.E. Andersson, (1993) J. Am. Oil Chem. Soc., 70, 939
6]. P. Sandra, A. Medvedovici, Y. Zhao, F. David, (2002) J. Chromatogr. A, 974, 231–241.
7]. L. Mondello, P.Q. Tranchida, V. Stanek, P. Jandera, G. Dugo, P. Dugo,
(2005) J. Chromatogr. A, 1086, 91–98
8]. I. Francois, P. Sandra, (2009) J.Chromatogr. A, 1216, 4005–4012
9]. P. Dugoa, M. Beccaria, N. Fawzy, P. Donato, F. Cacciola, L. Mondello, (2012) J. Chromatogr. A, 1259, 227– 236.
10]. E. Leselier, and A. Tchapla, “Mise au point de l’analyse des triglycerides en chromatographie subcritique sur colonnes remplies.” in Proceedings du 3me Colloque sur les Fluides Supercritiques, Grasse, France, (1996) pp.115-126.
11]. E. Lesellier, A. Latosa, A. Lopes de Oliveira, (2014) J.Chromatogr. A, 1327, 141– 148.
12]. J.W. Lee, T. Uchikata, A. Matsubara, T. Nakamura, E. Fukusaki, T. Bamba, (2012) J. Biosci. Bioeng. 113(2), 262–268,
13]. K. Horia, A. Matsubara, T. Uchikata, K. Tsumura, E. Fukusaki, T. Bamba, (2012) J. Chromatogr. A, 1250, 99– 104
14]. T. Uchikata, A.Matsubara, S. Nishiumi, M. Yoshida, E. Fukusaki, T. Bamba, (2012) J. Chromatogr. A, 1250 205– 211
15]. T. Yamada, T. Uchikata, S. Sakamoto, Y. Yokoi, S. Nishiumi, M. Yoshidad, E. Fukusaki, T. Bamba,
(2013) J. Chromatogr. 1301, 237-242
16]. M. Garzotti, L. Rovatti, M. Hamdan , (2001) Rapid Commun Mass Spectrom. 15, 1187-1190.
17]. M. Méjean, A. Brunelle, D. Touboul, “Supercritical fluid chromatography (SFC) coupled to a Q-TOF mass spectrometer for natural compounds analysis”, Poster, 2012 International Symposium of Supercritical Fluid Chromatography, available on-line through Green Chemistry Group.
18]. Q. Zhou, B. Gao, X. Zhang, Y. Xu, H. Shi, L. Yu, (2014) Food Chemistry 143 199–204.
19]. C. Baiocchi, G. Saini, C. Cocito, D. Giacosa, M. A. Roggero, E. Marengo, M. Favale, (1993), Chromatographia, 37, 525-533.
20]. A. Stabey, C. Borsch-Jensen, S. Balcher, J. Mollerup, (1994) JAOCS 71, 355-359.
21]. C. Borch-Jensen, J. Mollerup, (1996) Chromatographia 42, 252-258.
22]. M.N. Dunkle, F. David, P. Sandra, M. Volmer, Agilent technologies, Inc. Application Note 5991-0987EN,
Published Nov. 1, 2012.


-(1).jpg)