Data handling
Published over 4 years ago. See the latest and most current information on Data handling.
Method development projects have become increasingly complex to meet the demands of scientific rigor and regulatory agencies. Such complexity has not always been matched by an increased sophistication in data management practices. We present a project-based approach to data management for LC method development, which connects the data management scheme to the method development strategy, making it easier to understand experimental data in context and to preserve a complete snapshot of the project for future review.
Introduction
A truism of modern analytical method development is that methods should be developed systematically. This has been the understanding for over a decade now: the International Conference on Harmonization (ICH) described QbD principles in 2009, in its first revision to the Q8 guideline [1]. The revision prompted, or at least coincided with, a dramatic increase in method development publications featuring QbD, an upward trend that has continued through 2020.
Though systematic method development is now employed in many laboratories, the systematic management of data is a much-less-discussed topic. Modern approaches to method development generate large quantities of data that must be understood in context - in relation to other experiments, to the method parameters, and to the overall development strategy.
A truly organised approach would systematise not only the design and analysis of experiments, but the relationships between information, from sample selection to final decision. Here, we present a software-assisted workflow for LC method development that centralises data management.
Experimental
The method development data was analysed and managed with ACD/AutoChrom software. For illustrative purposes, example data was used from a project originally conducted by a collaborator.
Discussion
Defining the method strategy
As strategy is the backbone of systematic method development, it should also be the backbone of any data management solution.
We built our project around the original two-wave method development strategy (Figure 1): (1) column, buffer, and solvent screening, and (2) gradient optimisation. Method parameters were set for each step, including:
A. Screened columns (Acquity BEH C18, 50 mm x 2.1 mm x 1.7 μm; Acquity HSS T3, 50 mm x 2.1 mm x 1.8 μm; Acquity BEH Phenyl, 50 mm x 2.1 mm x 1.7 μm; Acquity BEH Shield RP18, 50 mm x 2.1 mm x 1.7 μm)
B. Screened buffers (10 mM ammonium formate, 10 mM ammonium bicarbonate)
C. Screened solvents (acetonitrile, methanol)
D. Suitability criteria for gradient optimisation
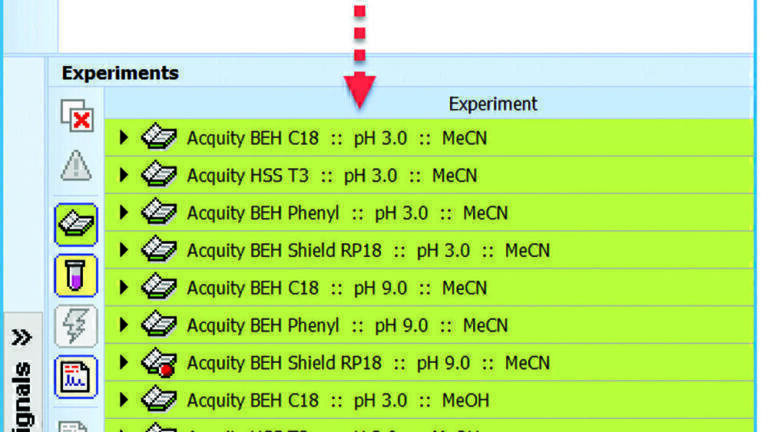
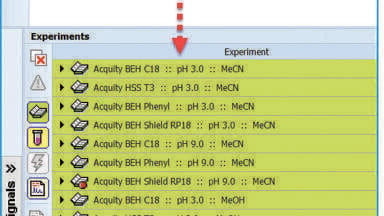
No experiments needed to be explicitly defined. Instead, the software generated lists of required and suggested experiments from the strategy criteria, and linked each list to its corresponding strategy wave (Figure 2).
Combining samples of interest
In many method development scenarios, a final method must be suitable for several types of samples. For example, in a forced degradation study, samples might be stressed by different conditions (light, heat, acid, base, oxidisers, etc.) and at different timepoints. The example data we worked with included simvastatin degradants produced under both acidic and oxidising conditions.
The different samples do not necessarily contain the same components. Samples at longer timepoints, or subjected to different stresses, will probably contain degradation products unseen in other samples. Rather than choosing one or the other chromatogram to optimise, or requiring manual combination of chromatograms, AutoChrom automatically combined different samples into a composite chromatogram (Figure 3).
Working from an automatically generated composite chromatogram allows scientists to easily account for all peaks that must be separated, without taking any extra steps to assemble information. With two different conditions, that might be relatively trivial, but in degradation studies involving several conditions and controls, the work and time saved would be much greater.
Comparing separation quality
Comparing composite chromatograms, especially their separation of critical pairs, is one way to judge separation quality. But modern chromatography also relies on more rigorously defined Critical Quality Attributes (CQAs), which might include resolution, run time, retention factor, detection limit, and more [2].The choice depends on the chromatographer and the experimental context.
In fact, a scientist might consider several CQAs important for a particular method. All of them need to be above some threshold value, but then it becomes a balancing game: a little decrease in one might be justified for a larger increase in another. To account for this game of compromises, chromatographers often use the product of the normalised individual CQA values [3].
In AutoChrom, data from the screening wave was transferred to the simulator window for experimental comparison (Figure 4). The software automatically calculated a Suitability Coefficient, based on the product of the three CQAs: resolution, runtime, and retention factor. Each CQA was normalised to a score between 0 and 1, based upon user-defined suitability criteria (Table 1).
This allowed comparison of screening chromatograms on a holistic level. For example, the second set of conditions in Figure 4A (Acquity BEH Phenyl (50 mm x 2.1 mm x 1.7 μm), pH 9.0, acetonitrile) had a Suitability Coefficient of 0.7, outperforming the third set of conditions (same column and solvent, pH 3.0) by sacrificing a little in runtime for a larger increase in resolution.
But Suitability Coefficient is not the only possible comparison criterion, especially in a screening wave [2]. Other criteria for comparison include minimum resolution, mean resolution, maximum asymmetry, number of components detected, and more (Figure 4B). AutoChrom automatically calculated several of these as well, displaying them along with the Suitability Coefficient in one interface for easy comparison and sorting.
Modelling separations for optimisation
While screening waves involve picking the best separation from among several executed experiments, optimisation involves modelling the separation’s dependence on the independent variables, so the best conditions can be found even if they have not been experimentally run. Thus, accurate prediction is crucial to accurate optimisation.
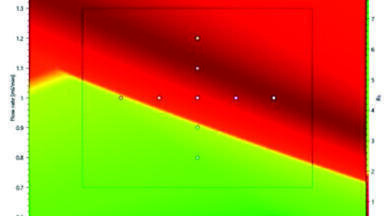
The first aspect of accurate prediction is a well-characterised LC system. Before beginning any optimisation experiments, chromatographers should measure dwell volume and run in-house and system tests to ensure optimal instrument performance.
The second aspect of accurate prediction is appropriate modelling. In AutoChrom, data from the gradient optimisation wave was again transferred to the simulator window, this time for experimental modelling and optimisation. A quadratic model was built to predict the effect of %B on retention factor, fitting each component separately to the generic equation:
ln k’=a+bX+cX2,
where k’ is the retention factor, X is the percentage of solvent B (expressed as a decimal), and a, b, and c are coefficients that must fit the experimental data.
But how well did the model perform? AutoChrom provided, in a related window, a comparison of the calculated and experimental retention times (Figure 5). All but 2 of the 24 comparisons were exact within 3 decimal places, and even the 2 larger errors were off only by 0.1 and 0.3 minutes. The model fit the experimental data extremely well.
Other tools were also available in the same interface to evaluate fit. Experimental and calculated chromatograms were overlaid for comparison. And for each component, experimental retention time was plotted against calculated retention time, to evaluate how close the points fell to the line y=x. The correlation coefficient for the fit was indistinguishable from 1 at a precision of 4 decimal places.
The final method, which incorporated a fourth experiment to refine and confirm the model, used a gradient of 9 to 98% B over 3 minutes, with an Acquity BEH Shield RP18 column (50 mm x 2.1 mm x 1.7 μm), a strong phase of acetonitrile, and a weak phase of water buffered with 10 mM ammonium bicarbonate.
Holistic data management
All the data was managed and interlinked through a single interface (Figure 6). The strategy formed the backbone of this project, here visible as the sequence of ‘waves’ in Panel B. Connected to each wave was its list of experiments (panel D), which included the method parameters, the experimental and predicted retention times for each component, and Suitability Coefficients for comparison. The data in this list was automatically linked to displays in panel C, which showed the chromatograms, UV spectra, and mass spectra associated with each experiment. To view the chromatograms in more detail and explore the selection, modelling and optimisation, the experiments in panel D could be transferred to the simulator window from the context menu.
Alternatively, one could review the experiment by way of components (panel A). Seven components were identified here by mass, with four of them also being associated to structures. The chemical formulae are shown in the table, with structures displayed in panel C where available.
By interlinking all parts of the experiment in the software, comparison of experiments and reviewing of past projects was easier, and we always had access to the strategies behind experiments and the data and models behind decisions.
As often necessary at the end of a project, we exported the method development information to a template-based report for easy sharing. The chromatographic data and metadata could also be pushed to a local or enterprise database for repurposing.
Conclusions
Strategic, rationally motivated method development approaches have added much-needed rigor to LC method development, and allowed chromatographers to meet the demands of regulatory agencies in industries like pharma. But the complexity of these new approaches has not always been met with corresponding improvements in experimental data handling, with data and notes sitting in the same chromatography data systems, electronic notebooks, and local directories as they did before.
We show here that software designed for strategic development can also help manage the complexly interlinked information from such experiments. Data means nothing outside of its experimental context and motivations. Thus, by making the development strategy the backbone of a data management system, data is connected by default to the overarching goal of the project. Moreover, by linking the data along important dimensions (by experiment, by strategy wave, or by component), it can be more easily understood in comparison to related results.
Now that Quality by Design approaches to LC method development are well established, it is time for Quality of Data Management to follow.
References
[1.] ICH Q8(R1) Guideline for Industry. Pharmaceutical Development, January 2008. available at www.fda.gov
[2.] M. McBrien. Practical Implications of Quality by Design to Chromatographic Method Development. Chromatography Today, May/June 2010.
[3.] B. Bourguignon, D.L. Massart, J. Chromatogr. A 586 (1991) 11–20.


-(1).jpg)