GC, MDGC
Published over 10 years ago. See the latest and most current information on GC, MDGC.
The determination of water content in solvents, alcoholic beverages and various consumer products such as foods, pharmaceuticals, fuels, and petroleum products is one of the most common types of chemical testing. Many techniques such as gravimetric analysis, Karl Fischer Titration, near infra-red spectroscopy, gas chromatography (GC) and others have been used for water quantification with good results [1]. However, the limitations of these approaches can include high limits of detection, large sample sizes required for trace analysis, side reactions, the use of expensive consumables, and the production of chemical waste. Previous work by Professor Daniel Armstrong and co-workers has described the use of ionic liquid GC capillary columns for the trace analysis of the water content in a wide variety of solvents [2]. These columns were capable of providing a rapid and quantitative determination of water content using very small sample amounts. This paper further examines the characteristics of ionic liquid capillary columns for the GC measurement of water.
Ionic liquid stationary phases have been discussed in a series of papers over the years describing the unique selectivity and ability to tune the properties of the phases for a number of different applications [3, 4, 5, 6, 7]. Presently, a series of three ionic liquid capillary GC columns of different selectivities are characterised by their ability to produce a sharp peak shape for water and other small polar analytes. The water peak produced by these columns is sharp enough to allow for proper integration and subsequent quantitation. Due to the high polarity of the ionic liquid stationary phases, water also does not interfere chromatographically with the analysis of many other small aliphatic and polar analytes. The three phase chemistries of these columns are available under the names WatercolTM1460, WatercolTM1900 and WatercolTM1910. Figure 1 shows the structure of each of the chemistries. The composition of all three phases demonstrates the unique combinations of cations and anions that can be used to prepare ionic liquid phases. The WatercolTM1460 phase is tricationic phosphonium based, while the WatercolTM1900 and WatercolTM 1910 phases are both dicationic imidazolium based with differing pendant groups. These pendant groups contribute to the selectivity difference. All three phases contain trifluoromethanesulfonate as the anion. The descriptive numbers for each phase (1460, 1900, and 1910) indicates the Kovats Retention Index (KRI) value of water determined on each at 100°C isothermal oven temperature.
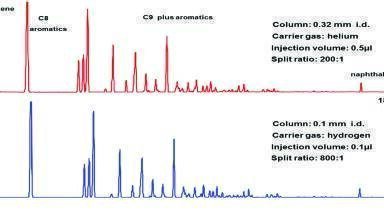
To show the sharp peak shape obtained for water, and also highlight selectivity differences, a QC test mix containing water was analysed on each column under identical run conditions. The resulting chromatograms are presented in Figure 2. As shown, each column is capable of producing a water peak that is sharp enough to be properly integrated. The retention of water (peak 2) is lowest on Watercol 1460 and greatest on Watercol 1910. Conversely, retention of the tridecane, an n-alkane (peak 1), and naphthalene, an aromatic (peak 6) is greatest on Watercol 1460 and lowest on Watercol 1910.
Differences in selectivity are also revealed when water is the injection solvent. To demonstrate this, an 8-component solvent mix in water was analysed on each column under identical run conditions. Figure 3 shows the resulting chromatograms. A low initial oven temperature of 35°C allowed the small polar analytes to partition into the stationary phase. A final oven temperature of 125°C ensured that the water was completely eluted from the column.
A 5-point calibration curve for water using standards prepared in absolute ethanol was generated on Watercol 1460. Both FID and TCD were used, which allowed the calibration curve to be subsequently used to quantify water in gasoline. The concentration range covered 0.05% to 1% (v/v). Concentration was plotted against TCD response of the water peak (as area counts). A blank ethanol sample was also analysed, which was used to blank correct each calibration point. The resulting chart is displayed in Figure 4. The r2 value of 0.9961 indicates good linearity across this range.
Residual moisture in fuel is very undesirable because it reduces the heat of combustion which increases engine stress. It can also corrode fuel system components, permit gelling of fuel in cold temperatures through ice crystal formation/nucleation, and accelerate the growth of microbial colonies which can clog fuel systems. Watercol 1460 was evaluated for the suitability to perform the analysis of water in gasoline. In addition to producing a sharp water peak, its selectivity results in elution of the water peak free from most other constituents present in gasoline. Plus, its maximum temperature of 260°C allows for timely elution of the heaviest gasoline components.
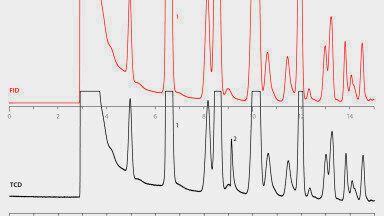
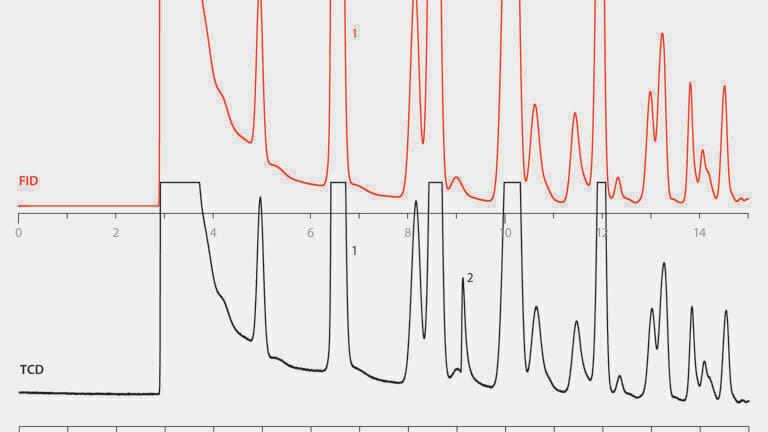
Two identical columns were installed in a single inlet using a 2-hole ferrule. Each column was connected to a separate detector to permit the simultaneous detection of gasoline components as well as water. Triplicate samples of unleaded gasoline were analysed, both “as is” and spiked with water at 0.25% (v/v). Figure 5 shows representative chromatograms. Reproducibility was very good (RSD <5%) for the spiked gasoline replicates. The calibration curve shown in Figure 4 was used for quantitation. The average response factor calculated from each point of the curve had an RSD value of <20%, thus it was used to calculate the amount of water in the gasoline samples. The average concentration found in the unspiked gasoline replicates was subsequently subtracted from the average concentration measured in the spiked replicates. The blank corrected method accuracy was determined to be 79% at the spike level used.
Fusel alcohols are by-products of the fermentation process. Four of these (n-propanol, isobutanol, active amyl alcohol, and isoamyl alcohol) are important to alcoholic beverage manufacturers due to their contributions to the aroma characteristics. A tequila sample was analysed for the presence of aroma fusel alcohols using an FID and TCD detectors. The FID yielded greater responses for the alcohols, whereas the TCD produced a response for water. As shown in Figure 6, all four aroma fusel alcohols were detected in the tequila sample. Good peak shapes and resolution were obtained, allowing for distinct detection of these compounds. In addition, the selectivity of the phase resulted in elution of both ethanol and water free from all other analytes.
Ionic liquid GC phases based on new selective combinations of cations and anions have been tailored to produce capillary columns that can be used for the quantitative measurement of water in various samples. Three new selectivities have been demonstrated, offering the ability to resolve water and other organic compounds in a wide variety of sample types. This makes GC a viable approach for the measurement of water, giving laboratories the option to avoid the use of techniques which produce chemical waste and/or are more expensive to perform.
[1.] S. Inagaki, et. al., Anal. Methods, 2015, 7, 4816-4820
[2.] R. Woods, et.al., LCGC Europe, Vol. 24, Issue 10, 2011
[3.] D.W. Armstrong, et. al., J.Am.Chem.Soc., 2005, 127, 593-604
[4] C. Cagliero, et. al., J. Chromatogr. A, (2012), 1268, 130
[5] C. Ragonese, et. al., Anal. Chem., (2011), 83, 7947
[6] C. Poole, et. al., J. Chromatogr. A, (2014), 1357, 87-109
[7] C. Kulsing, et. al., LC-GC Europe, August 2015, 434-440