Laboratory Products
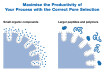
Environmental Water Analysis: Expand Your Toolbox
Jul 12 2022
Author: Nick Jones on behalf of LECO Corporation
Environmental analysis of water samples is often an underappreciated aspect of monitoring or processing infrastructure. It certainly isn’t easy: whether it’s checking for pollutants in a river or the quality of drinking water, water samples frequently have complicated, dirty matrices. They can foul up instruments, requiring downtime to clean ion sources, and often have heavy co-elution of analytes, making identification difficult at best. While many countries have regulations in place to maintain safe levels of various chemicals, no written list can contain every last signal that might be concerning. Where can you start if you don’t even know what you’re looking for?
Gas Chromatography (GC) coupled with Time-of-Flight Mass Spectrometry (TOFMS) is an excellent tool for water analyses. With TOFMS, the ions’ mass-to-charge ratio (m/z) is determined via time measurement. The first TOFMS was developed in the 1950s, by Dow, and as the technology has been refined, the popularity and usefulness of this technique has grown. With TOFMS, one sample run results in the full mass range data, with no compromises needed in acquisition rates. In addition, there is no spectral skewing with changes of analyte concentration, unlike with scanning mass spectrometers like quadrupoles.
These two advantages allow a sufficient number of high quality mass spectral data points to be collected across even very narrow peaks, regardless of concentration, which is vital for accurate and reliable deconvolution to occur. It allows both Target Analysis and Non-Target Screening to occur simultaneously, enabling additional investigation, perhaps to monitor trends and patterns in the types and levels of other chemicals. Since all of the data is already collected, this also allows a historical record to be built up, so if a new contaminant is discovered, for example, previous samples can be checked to see when it started appearing.
Figure 1. A comparison of TOFMS and Scanning MS chromatograms over the entire GC peak width. As the analyte concentration changes, the mass spectra remains consistent with TOFMS.
TOFMS provides more than just quality data: it can provide quality data quickly and cheaply. Depending on the instrument chosen, GC-TOFMS can be set up to run with hydrogen as a carrier gas instead of helium. This is much more budget-friendly with the rising cost of helium, and it doesn’t take much of an initial investment.
Method transfers can be handled easily with online tools, and by swapping out the column for a narrower, shorter one, the same sort of spectral resolution can be obtained in a fraction of the time.
Using a GC-TOFMS with an open ion source is another way to ease some strain on your analyses: an open ion source minimises the interaction of sample ions with the surfaces of the instrument, eliminating the need for cleaning.
This is especially useful when combined with hydrogen as the carrier gas, which is frequently seen as problematic for robustness and mass spectral continuity with typical ion source designs. An open ion source design in your instrument eliminates that concern entirely.
Figure 2. A comparison of chromatograms for the same sample run with helium and hydrogen carrier gases and a close-up of trichlorophenol with helium and hydrogen carrier gases. Chromatogram 1 shows helium carrier gas and a run time of more than 30 minutes with a resolution of 1.66. The library match confidence is 941. Chromatogram 2 shows the same sample run with a direct method transfer to hydrogen carrier gas. The run time has dropped to less than 10 minutes with a resolution of 1.58 and a library match confidence of 935. Chromatogram 3 uses the same sample with the method optimised for speed. The run time is now less than 8 minutes, and the resolution is 1.51.
Even with all the benefits of GC-TOFMS, sometimes it isn’t enough for challenging water matrices. This is where GCxGC comes into play as an additional tool for your laboratory. The original two-dimensional GC was called ‘Heart-Cut’ chromatography, where just a specific portion of the effluent from one column is diverted to a different column for a wide-peaked slice of additional information. However, true comprehensive GCxGC traps the entire effluent from the first column with a modulator, which then re-injects the entire sample into a secondary column for a huge increase in chromatographic peak capacity and increased sensitivity. Various modulators can change the level of results you can obtain, allowing you to customise your instrument to your budget, but in all cases, using GCxGC-TOFMS results in improved deconvolution and more confidence in your samples.
The tools of TOFMS don’t stop with comprehensive two-dimensional GCxGC analysis. As the name Time-of-Flight implies, the flight time is very important to TOFMS. The longer the ions’ flight path is, the higher the resolution of the spectral results can be. High Resolution TOFMS (HR-TOFMS) is actually possible with innovative techniques such as a folded flight path using gridless mirrors and periodic ion lenses to reflect the ions back and forth, leading to mass resolution modes of 25,000 or 50,000. HR-TOFMS can be done with both one-dimensional GC or comprehensive GCxGC analyses.
There are plenty of other tools available to work in conjunction with TOFMS. Multi-mode ion sources allow ion mode switching without needing to make manual adjustments to your instruments, with Electron Ionisation (EI), Positive Chemical Ionisation (PCI), and Negative Chemical Ionisation (ECNI) modes enabling you to obtain a full chemical profile much more conveniently than ever before. This is especially useful for non-target screening and environmental analysis with compounds such as Endosulfan, which reacts very differently whether it’s being analysed with EI or ECNI modes.
The technology isn’t limited to just the hardware. TOFMS software has developed immensely since those early 1950s days, with automated tools allowing for confident deconvolution, library matching, and data set comparison. Data can be outputted to a variety of plots and charts and heat maps to enable you to zero in on the areas of your data that are the most interesting without spending significant time just trying to find those areas in the first place.
When all you have is a hammer, everything looks like a nail. Make sure you have more tools at hand for the most efficient and thorough environmental water analysis, so you aren’t just brute-forcing your samples to give you results.
Digital Edition
Chromatography Today - Buyers' Guide 2022
October 2023
In This Edition Modern & Practical Applications - Accelerating ADC Development with Mass Spectrometry - Implementing High-Resolution Ion Mobility into Peptide Mapping Workflows Chromatogr...
View all digital editions


Events
Apr 23 2024 Kintex, South Korea
Apr 23 2024 Seoul, South Korea
Apr 28 2024 Montreal, Quebec, Canada
May 05 2024 Seville, Spain
May 15 2024 Birmingham, UK