Bioanalytical
Review of Microsampling Techniques in Bioanalysis
Mar 08 2016
Author: Tony Edge and Chris Smith on behalf of University Of Liverpool
The pharmaceutical industry strives to generate new revenue and simultaneously reduce costs associated with research activities. The concept of microsampling tackles both of these issues, by addressing the technical challenges associated with the sampling of neonatals, and also addressing the issue associated with composite Pharmacokinetic (PK) profiles, which reduce the need in animal studies for larger sets of animals to be used. Clearly reducing the number of animals required for testing also addresses an important ethical issue.
The article will cover all aspects of microsampling, looking at the use of dried blood spots, and the use calibrated capillaries for the original sample collection. The use of blood or plasma as the sample will be assessed with particular reference to the haematocrit issue, as will be the issue of sample stability in these different forms.
Introduction
Within the pharmaceutical industry bioanalysis is used to determine the concentrations of the parent compound and any active metabolites within the biological entity. By plotting the concentration of these compounds as a function of the time, and interpreting the resulting curve, it is possible to determine the correct dosage for the patient. Factors such as AUC (area under the curve), Cmax (the maximum observed concentration within the body) and t1/2 (time required for the concentration to fall by half) allow for the efficacy of the drug to be determined over a period of time after dosing [1,2].
Reasons for microsampling
There are many scientific and ethical reasons for the interest in microsampling. The pharmaceutical industry has placed substantial emphasis on the 3R’s, (reduction, replacement, and refinement) and this has helped in reducing the volumes of samples taken from animals, which in turn can lead to a reduction of animals required for testing during pharmacokinetic profiling studies of a drug, as well as improving the scientific data.
Early Discovery pharmacokinetic studies routinely use rodents (typically rats or mice) as test animals, and substantial efforts have been focussed on implementing microsampling into this area. There is clearly a potential issue with blood volume in both of these rodent species and in particular if multiple samples are to be taken from one animal, removing the need for composite studies. These large volumes could cause anaemia or other secondary effects such as bone marrow and haematological changes, which would affect interpretation of primary drug effects. Wilson [3] stated that for a typical 4 week repeat oral dose rat study an additional three to nine satellite animals per dose group per sex might be required (depending upon the sample volume and number of time points required) in addition to ten main study animals. Investigation of longer studies, as seen in Table 1, will dramatically reduce the number of animals required. The reduction in the number of animals also results in a substantial reduction in the labour associated with these studies, as well as improving the scientific credibility of the data due to a reduction in the number of satellite animals.
The concept of microsampling has been around for some time [4-6] although the exact definition of a microsample varies. It has been generally accepted that microsampling refers to volumes less than 50 μL taken from the patient. The challenges associated with microsampling relate to being able to manipulate small volumes in an accurate manner as well as the detection of the analytes under investigation. The performance improvements associated with the detection devices currently available, in particular mass spectrometry, have resulted in the latter being less of an issue.
Approaches to Microsampling
Dried Blood Spots (DBS)
Different approaches have been employed to allow the collection of the blood sample. One of the most popular is the use of dried blood spots, which are routinely used on newborns for the so called Heel prick or Guthrie test, named after Robert Guthrie [7]. He introduced the test in 1962, for the analysis of the analysis of phenylketonuria, a diseases which afflicted his 15 month old niece. This disorder occurs when there is an error in amino acid metabolism and can impair brain development initially. The test been expanded to allow for early detection of Cystic Fibrosis, Congenital hypothyroidism, Phenylketonuria, Medium-chain acyl-CoA dehydrogenase deficiency (MCADD) and Sickle Cell Disease.
The application of this approach in a quantitative manner, within the pharmaceutical and clinical industries, has received much attention over the last decade [8-10]. This interest has been driven by the seminal paper by Spooner and Barfield from GSK [8] looking at using dried blood spots for the analysis of acetaminophen. The data from [8] demonstrated that quantitative results could be obtained using this approach with linearities covering a range of 0.1 to 50 μg/mL from dog blood and recorded standard deviations on the QC’s and standards all being well below 15%. The sample preparation of the collected dried blood spot was simple (extraction with an organic solvent, described in detail below), aiding the benefits of this approach for routine sample analysis. Several reasons were given why this approach would have successful uptake within the pharmaceutical industry, the primary ones being;
• Alignment with the ethical doctrines of the 3R’s.
• Reduced financial costs associated with taking samples due to elimination of refrigerated storage and shipping conditions
• Improved sample stability
In this publication the approach to sample preparation taken was to punch a 3 mm diameter disk from the centre of the DBS into a clean tube. Methanol (100 μL) containing internal standard ([2H4]-acetaminophen) was added and the tube vortexed mixed for approximately 30 s. The tube was centrifuged for 5 min. at 3000 g and the supernatant transferred to a clean tube and a portion injected onto the HPLC-MS/MS system.
One of the greatest challenges to this approach is the Haematocrit (HCT) issue [12]. The viscosity of blood can differ from one sample to another, since the amount of red blood cells to plasma can vary, indeed one of the issues associated with serial sampling from rodents is that the blood thins throughout the sampling regime, since the animal is not able to produce red blood cells quickly enough to replenish the ones that have been taken during the sampling process. In a non-regulated or Discovery environment this is not an issue, since many of the animals will have undergone very similar environmental experiences resulting in a similar HCT, which in conjunction with the wider tolerances for assay validation mean that this approach is very favourable. Unfortunately, the approaches developed at this stage have to be transferrable to the clinical regime, where patient HCT can be very variable [13]. This is particularly the case for patients that are undergoing some form of therapy, where the drug will ultimately be targeted. The effect of the HCT on cellulose based substrates is three fold;
• Spot area bias which increase with increasing HCT
• Recovery bias which reduces with increasing HCT
• Suppression bias which is random
The nature of the relationship between the effect and the HCT results in scenarios where drug concentrations can be under or over predicted dependent on which of the three effects is dominant.
Some solutions have been suggested by researchers for reducing or eliminating the HCT effect including;
• Apply a constant volume of blood and extract the whole dried spot [13]
• Use of alternative substrates for the sorbent paper [14]
• Haemolyse the blood sample prior to spotting [15]
• Use a filter mechanism to separate the red blood cells and the plasma, and using the plasma as the primary sample [16]
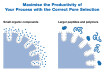
The Mitra® technology (Neoteryx LLC), Figure 1, uses the constant volume approach, and uses a pipetting type device to accurately absorb a known amount of fluid, in this case blood. The amount of blood that is taken up is consistent and does not vary for blood with differing HCT. A range of experiments have been performed using this technology to determine the robustness [13] investigating the drying time and also looked at the humidity effects which are known to be problematic for older style technologies. In all cases the recovery was found to be very good and the volume of blood that was absorbed was highly consistent.
Filtration devices
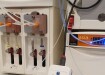
Li [16] used technology that allows for the sample to undergo a pre-separation of the red blood cells and plasma, leaving the plasma in a single layer on an absorption pad, Figure 2. This approach is very effective at eliminating the HCT effect. The technology uses a two layer polymeric membrane for the formation of a dry plasma spot series on the bottom sheet, with the red blood cells left on the top sheet. The lower membrane surface is then physically separated from the upper membrane and dried. Li further processed the sample using online solid-phase extraction cartridge followed by liquid chromatography coupled to tandem mass spectrometry (LC/MS/MS). The methodology was applied to the quantitative determination of guanfacine, although other compounds have been investigated by other authors [17].
This approach has the potential to eliminate the HCT as well capillary blood-to-plasma issues.
Stability of blood at room temperature
One of the advantages that is often associated with the DBS approach is the stability of the samples. Several authors have investigated and substantiated this claim [18,19]. Ganz discovered that the analyte concentrations in human blood after storage for 2 days at 6 ± 4°C showed a decrease of 2.2% at the QClow level and a decrease of 11.2% at the QChigh level for the two compounds under investigation [18]. Anderson [19] reported that a series of drugs of abuse, including flunitrazepam, temazepam, oxazepam, lorazepam, nitrazepam, diazepam, and cocaine, could be stored at 4°C for up to a month on a Guthrie card 903 with less than 20% loss in all cases, which is less than that observed with the corresponding liquid blood samples.
Automation
In the early work on DBS, there was very little automation, however the growing interest from the pharmaceutical industry on the application of DBS has seen a growth of automation techniques that can be applied to this technology.
One of the approaches developed by Prolab/Agilent uses a modified CTC autosampler (CTC Analytics AG, Zwingen Switzerland), and allows for the manipulation of the spotted cards into a flow through device which clamps the card and allows liquid to pass through part of the dried blood spot, Figure 3. The use of different sized clamps allows the users to alter the size of the blood spot that is being analysed. As with previous technology several authors have reported positive experiences with this approach [20].
Another approach is delivered by CAMAG who offer a “state of the art technology to analyse DBS”. The DBS are directly eluted in a designed extraction chamber and guided online to an analysis system, typically a LC-MS/MS. The sample processing is fully automated, including the application of an internal standard through a high precision sprayer. An in-built camera takes a picture of every sample before and after extraction. The instrument allows for high throughput analysis of up to 500 DBS cards per run, with typical run times being a few minutes per sample. It utilises a robotic system to handle the DBS cards from 5 separate racks, each with a capacity of 100 cards. The gripping tool picks up cards and moves them to all of the subsequent processes in the corresponding modules and back into their original position after the extraction. The extraction unit seals the DBS card and solvent is guided horizontally through the DBS into a sample loop. The flexibility in
the solvent use also ensures that carryover is minimised.
Spark Holland, renowned for their automated on-line SPE system, have used a similar approach to that employed by ProLab in developing the DBS Autosampler. The technology uses a modified CTC autosampler to manipulate the DBS cards, which are then placed in between two clamps where the patented flow through desorption technology elutes the analytes either directly to a HPLC column or to an automated in-line SPE instrument. One of the big advantages of this approach is that the whole sample is analysed, meaning that the HCT issue is no longer relevant. The device is very flexible allowing for full control of solvent compositions and also flow rates through each of the individual components, autosampler and also the on-line SPE. As with other devices it comes supplied with a camera that allows for the blood spots to be pictured before and after the extraction process.
The SPE is taken from their Symbiosis model and is a unique cartridge design where SPE cartridges are placed between clamps allowing for up to 400 bar pressure to be applied to the cartridge. With just the SPE cartridge in this is an unrealistic pressure, however with a suitable analytical HPLC column it becomes necessary for the clamp to be able to maintain the fluid flow at elevated pressures.
A couple of applications have benefitted from this approach including [21] and also [22]. In [21] the HCT was compared using a traditional approach and also using the DBS autosampler. The data was very encouraging with the average recoveries at a high HCT of 0.7 increasing from about 70% for haloperidol, amitriptyline and verapamil to very close to 100%. With the second application of the technique two anti-malarial drugs; chloroquine and amodiaquine, were tested along with their major metabolites; desethylchloroquine and monodesethylamodiaquine.
The very thorough investigation looked at several of the experimental parameters including the optimum card gradient elution solvent to achieve separation of the analytes, and also the optimal wash conditions for the SPE to effectively remove the phospholipids which are known to cause ion suppression.
Solutions have also been provided by a variety of other manufacturers including Hudson Robotics, Advion and Perkin Elmer.
Paper spray
A similar approach to the use of the dry blood spotting has been employed by Cooks [23]. However, this approach uses the sampling device as part of the analytical process. The sample is placed onto a paper triangle and then this triangle is placed in front of a mass spectrometer. A solution is applied to the sample followed by the application of an electric voltage applied to the paper resulting in a soft form of ionisation of the analyte into the mass spectrometer. It has been proposed that the sample solution escapes from the surface or slowly migrates randomly through the fibres of the paper, with the sharpness of the tip of the triangular paper having a substantial effect on ionisation efficiency. Cooks et al. [23-25] suggested that two modes of spray operate during the paper spray process. Mode one occurs in solvent-rich systems, in which multiple Taylor cone jets are created, resulting in the production of a range of droplet sizes, whereas mode two occurs at low solvent flow rates and the higher currents that may be produced as the result of a corona discharge. Although this technology is clearly some way from being a commercialised product it has profound implications for the field of bioanalysis and potentially chromatography.
Application to plasma samples
The use of microsampling is not, however, restricted to the manipulation of blood samples. Many researchers are actively striving to utilise the microsampling techniques in the manipulation of plasma samples which do not suffer from the challenges associated with the HCT. Indeed most of the techniques previously discussed can be readily applied to the sampling of plasma samples.
Microsampling capillaries
There are a variety of organisations that supply capillaries that will allow the sampling of the blood as it is removed from the patient. The capillaries are designed to have a set internal diameter and also a set length, which implies that there will be a set volume. Commercially available tubes exist in volumes as small as 250 nL up to 200 μL, with many different sizes that would accommodate volumes required for bioanalysis. The use of capillary action ensures that the capillary is filled. Once filled the capillary can then be used directly or the contents can be transferred to another sampling device such as Guthrie card or similar type of adsorbent paper material.
One of the most successful approaches that has been investigated is the use of Drummond tubes for the analysis of plasma samples. Initial work by [26] investigated the use of a blood sample of 75 µL taken into an EDTA coated, microcapillary containing thixotropic gel & self-sealing plug. The method then centrifuged an inverted microcapillary in 1.4 mL Micronic tube fitted with a pre-split cap. The tube acts as convenient holder and also facilitates labelling. The separated plasma, typically having a volume of 40 – 45 µL, was subsequently dispensed into labelled screw-top tubes. Bioanalytical methods were then developed which used 15 µL of plasma sample.
Conclusion
There is a substantial drive for the pharmaceutical and clinical markets to embrace microsampling. As discussed here there are several approaches that can be employed to satisfy this driver, however as yet very few, if any, of these approaches have been used in regulatory studies. The obvious issue with the whole blood analysis is the HCT effect and this needs to be addressed before this approach can be successfully employed within the pharmaceutical industry for regulated bioanalysis. The use of micro plasma samples does offer some distinct advantages over the whole blood approach, since it very much matches the technology that is currently used in many laboratories and consequently would be substantially easier to implement for most bioanalytical laboratories. The drivers for microsampling will be ever present and with the increase in sensitivity associated with modern mass spectrometers and the advancement of sample preparation technology, more and more emphasis will be placed on handling of the sample rather than the techniques to allow the quantification of the test compounds.
References
1. http://learnpkpd.com/2013/11/25/understanding-steady-state-pharmacokinetics/
2. http://www.dandybooksellers.com/acatalog/9780853695714.pdf
3. K. Chapman, S. Chivers, D. Giddon, D. Mitchell, S. Robinson, T. Sangster, S. Sparrow, N. Spooner, A. Wilson, Drug Discover Today, 19 (5) (2014) 528 – 532
4. C. Smith, A. Sykes, S. Robinson, E. Thomas, Bioanalysis, 3(2) (2011) 145-156
5. Microsampling in pharmaceutical bioanalysis, P. Zane, G.T. Emmons, pub. Future Science Group
6. S. White, G. Hawthorne, L. Dillen, N. Spooner, K. Woods, T. Sangster, Z. Cobb, P. Timmerman, Bioanalysis, 6 (19) (2014) 2581-2586
7. R. Guthrie, A. Susi, Pediatrics, Sep. 32 (1963) 338–343
8. M. Barfield, N. Spooner, R. Lad, S. Parry, S. Fowles, J. Chromatogr. B 870 (2008) 32–37
9. R.J.W. Meesters, G.P. Hooff, Bioanalysis, 5 (2013) 2187–2208
10. S. Brookes, K. Woodmansey, I. Love, Chromatography Today 36 – 39, May/June 2010
11. P. Denniff, N. Spooner, Bioanalysis, 2 (2010) 1385–1395
12. P.M. De Kesel, N. Sadones, S. Capiau, W.E. Lambert, C.P. Stove, Bioanalysis, 5 (2013) 2023–2041
13. J. Rudge, S. Kushon, A. Bischofberger, A. Carpenter, P. Denniff, Y. Guo, P. Rahn, N. Spooner, S. Osborne, E. Welch, C. Cordova, J. Layne, Chromatography Today 38-40, Nov. / Dec. 2014
14. R.M. Sturm, J. Henion, R. Abbott, P. Wang, Bioanalysis, 7(16) (2015) 1987-2002
15. A.J. Wilhelm, C.G. J.C.G. den Burger, E.L. Swart, Clin. Pharmacokinet., 53(11) (2014) 961–973
16. Y. Li, J. Henion, R. Abbott, P. Wang, Rapid Commun. Mass Spectrom., 26 (2012) 1208–1212
17. J.H. Kim, T. Woenker, J. Adamec, F.E. Regnier, Anal. Chem., 85 (2013) 11501–11508
18. N. Ganz, M. Singrasa, L. Nicolas, M. Gutierrez, J. Dingemanse, W. Döbelin, M. Glinski, J. Chromotogr. B. 885-886 (2012) 50-60
19. A.A. Alfazil, R.A. Anderson, J. Anal. Toxicol. 32 (2008) 511–515
20. R.V. Oliveira, J. Henion, E. Wickremsinhe, Anal. Chem., 86 (2), (2014) 1246–1253
21. J.A. Ooms, L. Knegt, E. Hermannus, M. Koster, Bioanalysis, 3(20) (2011) 2311-2320
22. R.V. Oliveira, J. Henion, E.R. Wickremsinhe, Bioanalysis, 6(15) (2014) 2027-2041
23. C-H. Lin, W-C. Liao, C. Hsin-Kai, T-Y. Kuo, Bioanalysis 6(2) (2014) 199–208
24. Q. Yang, H. Wang, J.D. Maas, W.J. Chappell, N.E. Manicke, R.G. Cooks, Z. Ouyang, Int. J. Mass Spectrom., 312 (2012) 201–207
25. J. Liu, H. Wang, N.E. Manicke, J.M. Lin, Z. Ouyang, R.G. Cooks, Anal. Chem. 82(6) (2010) 2463–2471
26. C.L. Bowen, H. Licea-Perez, M.Z. Karlinsey, K. Jurusik, E. Pierre, J. Siple, J. Kenney, A. Stokes, N. Spooner, C.A. Evans, Bioanalysis, May, 5(9) (2013) 1131-5
Digital Edition
Chromatography Today - Buyers' Guide 2022
October 2023
In This Edition Modern & Practical Applications - Accelerating ADC Development with Mass Spectrometry - Implementing High-Resolution Ion Mobility into Peptide Mapping Workflows Chromatogr...
View all digital editions


Events
Apr 23 2024 Kintex, South Korea
Apr 23 2024 Seoul, South Korea
Apr 28 2024 Montreal, Quebec, Canada
May 05 2024 Seville, Spain
May 15 2024 Birmingham, UK