Laboratory Products
Trends in Particle Size Analysis Quality Control in the Fertiliser Industry with Dynamic Image Analysis
Jul 09 2014
Author: Joerg Westermann on behalf of Microtrac Retsch GmbH
Particle size analysis is an important step in the quality control of many industrial production processes. This article describes the implementation of Dynamic Image Analysis (DIA) in the fertiliser industry as a typical example. DIA is used in the same way in other industries, for example for pharmaceuticals, foodstuff, plastics, chemicals, metal powders and even granulated explosives.
Fertilisers are typically dried bulk materials, which enhance the supply of nutrients for cultivated plants. The most important components of a fertiliser are nitrogen, phosphate and potassium, as a lack of these elements in the soil limits plant growth. Many fertiliser producers combine these elements in order to improve the soil in a controlled and systematic way.
Fertilisers are usually produced in a granulated form to optimise handling, dosage and controlled release of the nutrients. Manufacturers use two special terms to characterise the particle size of their products. The average particle size is called SGN, Size Guide Number, and the width of the size range is called UI, Uniformity Index. Both numbers are closely monitored for each fertiliser batch, as they influence not only the dissolution and release on the field, but also the blending of different minerals and the segregation during transport.
Another critical aspect is the amount of dust generated both during production and in the final product. Dust particles can be absorbed through inhalation or through the skin by the workers in production or during loading/unloading which may cause health issues.
Quality Control of Particle Size and Shape
The traditional method for particle size analysis in the fertiliser industry is sieve analysis. This is a simple method, but time consuming, with poor reproducibility, and prone to systematic and individual operator errors. Dynamic Image Analysis is superior to sieve analysis in its resolution, precision and reproducibility; it also has the capability of providing additional detailed information on particle shape. Importantly, the DIA technique is much faster than the sieving method, so the production parameters can be monitored and adjusted in real time. This would mean that production could be optimised to just meet the specification, thus reducing cost and achieving superior product homogeneity. The DIA technique could be used to measure 15-20 samples per hour, even in 24/7 operation.
The results of DIA are operator independent. Users who installed several instruments in their factories worldwide find that CAMSIZER provides much better reproducibility of measurements taken at their different sites compared to sieve analysis.
Dynamic Image Analysis with
Patented Dual Camera Technology
With the installation of in excess of 900 CAMSIZER systems worldwide, this optical particle analyser is the most successful instrument for particle size and particle shape analysis of dry bulk materials with Dynamic Image Analysis. The system is a well-proven alternative to traditional sieve analysis and also allows for reliable detection of the dust fraction.
Main application areas include quality control, research and production monitoring. The CAMSIZER has the option of either partial or complete automation of the production process control using on-line or at line options.
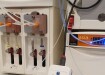
Figure1. The CAMSIZER P4 features a patented dual camera system
The dual camera system of the latest generation, CAMSIZER P4, is superior to any other dynamic image analysers having a wider particle size range of 20 μm to 30 mm, analysis speed, accurate shape detection and resolution. The dual camera system provides optimised analysis conditions across the particle size range with no hardware changes and without compromising resolution or precision.
The vibrating chute feeds the sample to the CAMSIZER P4 and all particles fall individually through the measurement field. During the measurement procedure the two digital cameras (low noise CCDs) measure simultaneously. The basic camera detects large particles and the zoom camera detects the small ones. The combination of the varying image scale on each of these cameras allows both small and large particles to be captured at a high resolution.
Figure 2. The CAMSIZER P4 measures particles in a size range from 20 µm to 30 mm
The frame rate of the camera and the size of the measurement area determine the speed in which the particles can be measured. In order to replace the dual camera system with a single camera, it would require images with more than 40 megapixels with a frame rate of at least 30 Hz, which is currently not available.
CAMSIZER Versus Sieve Analysis
For fertilisers which consist of round particles the comparison between sieve analysis and CAMSIZER P4 results is excellent, even with multimodal distributions typical for mixtures of different minerals. Note the considerably higher resolution of the CAMSIZER curves compared to the few sieve classes displayed in Figure 3.
Due to the systematic differences between the methods ‘sieve analysis’ and ‘DIA’, the results will not agree in applications where the particles are irregular shaped, for example grains of sand. This is shown in Figure 4, left side. However, with the sieve correlation function, which is included in the CAMSIZER software, it is possible to achieve an almost 100% agreement, as demonstrated in the right hand side of Figure 4.
Figure 3. Comparison of sieve analysis results (blue) and CAMSIZER results (red) for round fertiliser particles. The agreement is excellent, both for monomodal (left) and multimodal (right) distributions (mixtures).
Figure 4. Comparison of sieve data (blue) and Camsizer data (red) for irregularly shaped particles. Although the result of the two methods is slightly different in the first place (left diagram), the CAMSIZER software achieves a perfect consistency by the integrated sieve correlation (right diagram).
Digital Edition
Chromatography Today - Buyers' Guide 2022
October 2023
In This Edition Modern & Practical Applications - Accelerating ADC Development with Mass Spectrometry - Implementing High-Resolution Ion Mobility into Peptide Mapping Workflows Chromatogr...
View all digital editions


Events
Apr 23 2024 Kintex, South Korea
Apr 23 2024 Seoul, South Korea
Apr 28 2024 Montreal, Quebec, Canada
May 05 2024 Seville, Spain
May 15 2024 Birmingham, UK