Laboratory Products
How to Minimise Standard Deviations by Correct Sample Preparation
Feb 08 2016
Author: Dr Tanja Hanke on behalf of Retsch GmbH
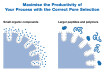
Modern analytical methods increase precision and push detection limits to make even the smallest traces of sample components detectable. Despite this development sample preparation, which is carried out prior to the actual analysis, is frequently neglected. Errors caused by lacking accuracy in sample preparation have a much bigger impact than errors made during analysis. Just like an iceberg which is mostly hidden under water, only a small part of the sum of errors is perceived whereas the major part of potential errors is not taken into account (Figure 1). One of the reasons may be the fact that sampling and sample preparation have always been done in a traditional way which has become a routine over the years and is no longer considered as having a critical influence on the subsequent analyses.
Sampling
The more heterogeneous a sample is the more important correct sample preparation becomes. Before a sample is taken from a sand heap, for example, several questions have to be answered.
- Which is the correct sample amount so that all sample properties of the original lot are represented?
- Does it have any influence from which area of the heap the sample is taken?
- Did the sample segregate so that bigger particles are mostly found in the upper part of the heap?
If the last question is answered with yes, the subsample taken from the upper part of the heap does not represent the initial lot. Also less obvious aspects can have an influence here: if the heap of sand was stored outside, then the material on the surface of the heap contains more moisture than the inside part. This means that the property ‘moisture’ is distributed heterogeneously in the initial material.
These simple examples demonstrate that sampling and the complete sample handling process have a strong impact on analytical results. Reproducible results will only be feasible, if the subsamples are representative.
Sample Division
The properties of a laboratory sample are usually heterogeneously distributed; milling helps to homogenise the sample and to equally distribute its properties. Only a few grams or milligrams of the laboratory sample are required for the subsequent analysis. Hence, larger subsamples have to be divided representatively. Standardised methods such as coning and quartering or the use of sample splitters or sample dividers help to divide the subsamples, showing that increased automation reduces statistic errors and increases representativeness of the subsample.
In Retsch´s Rotating Sample Divider PT 100, the sample is fed into the hopper and automatically transported via a feed chute to the openings of an evenly rotating dividing head. This divides the sample into 6, 8 or 10 subsamples. After the division, several subsamples can be merged or one subsample can be further divided. If the division is repeated with identical parameters, it provides comparable results so that the analysis is reproducible. Thus, standard deviations can be decreased significantly by correct sample division. The following example shows analysis of a laboratory sample of Hyflon. The humidity of 10 samples was measured with the thermogravimetric analyser Thermostep from Eltra. This instrument consists of a programmable oven including a scale and a sample carousel and measures the humidity, ash content and volatile components of up to 19 samples fully automatically. The loss of weight of 10 samples (1-10) after correct sample division in the PT 100 was 1.3% ± 0.05%. Another 10 samples (11-20) were not divided correctly but taken randomly from the laboratory sample, showing a loss of weight of 0.99% ± 0.1% (Figure 2).
Homogenisation of Samples by Grinding
Many laboratory samples cannot be analysed directly because they contain big or segregated particles. Big particles can be a problem because most analytical methods will not measure all components of the particle but only the surface. The effects of segregation are described above. Grinding those samples helps to reduce the particle size so that the inner parts become available for analysis. Ideally, the properties which are originally spread heterogeneously all over the sample are distributed homogenously after the grinding step. The following examples demonstrate that correct sample preparation is a pre-requisite for minimum standard deviations and increased reproducibility of analytical results.
Application Example Rye
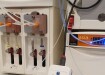
The example of rye shows different results for inhomogeneous and homogeneous samples in NIR analysis (10 measurements of each sample). The rye was ground in Retsch`s Cyclone Mill TWISTER (Figure 3). This mill grinds fibrous and soft samples, such as corn or feed pellets, quickly and efficiently with impact and friction. The high speed and the optimised shape of the rotor and the grinding chamber generate an air stream which transports the sample through the integrated cyclone into the 250 ml sample bottle while the sample is cooled. Additionally, most of the sample residues are removed thanks to the air stream. Three speeds and sieves with different aperture sizes allow for optimum adaption to a wide range of samples. For example, 160 g rye was ground at 14,000 min-1 to < 1 mm in 1 min, using a 1 mm sieve. Table 1 shows the significant differences of the ground and the unground sample with regard to the protein and fibre content. The fibre content of the unground sample is higher than that of the ground sample because only the surface area of the rye was analysed.
Table 1: Comparison of the fibre and protein content of an unground and a ground rye sample
Application Example Lignite
4 kg lignite, which is a very inhomogeneous material, was crushed to 8 mm particles using the Jaw Crusher BB 300. Retsch offers four different models of jaw crushers which are suitable for hard and brittle samples with 35 – 130 mm initial particle size. Depending on the jaw crusher model, a final particle size of 0.5 – 2 mm can be achieved. After crushing and subsequent representative sample division a 100 g subsample was finely ground to 100 µm in 30 s in the Ultra Centrifugal Mill ZM 200 at 18,000 min-1, using a 0.12 mm ring sieve. In this high speed rotor mill the sample passes through a hopper and hits a horizontal rotor, where centrifugal forces throw it outwards. The particles hit the rotating teeth of the rotor and are crushed in the process. Further size reduction is achieved when the particles are ground between rotor and sieve through shearing forces. The sample remains in the grinding chamber for only a very short time before it is collected in the cassette. Therefore, the sample properties are not altered during the grinding process. The sample can be fully recovered thanks to the patented cassette system which helps to avoid cross contamination.
The carbon and the sulphur content of the 8 mm and the 100 µm lignite sample were determined with the Elemental Analyser CS-580 from Eltra (figure 4, Table 2). The CS-580 burns samples at 1350°C before it detects the emitted gases with infrared cells. The analysis of a single sample takes about 90 s, the evaluation is done with a user-friendly software.
Table 2: Determination of the carbon and the sulphur content of lignite with different particle sizes (10 measurements of each sample)
These results reveal that by increasing the homogeneity of the sample the standard deviation drastically decreases. The standard deviation of the sulphur content is reduced from almost 100% of the initial value to less than 10%.
Case Study Compost
Compost consists of different types and fractions of soil, wood and other organic particles and may even contain plastic parts. For such a heterogeneous material as compost thorough homogenisation is crucial to ensure reliable analysis results.
100 g sample was cut into particles <4 mm with Retsch`s Cutting Mill SM 300 (Figure 5) at 3,000 min-1 using the parallel section rotor and a 4 mm bottom sieve. The SM 300 is perfectly suitable for grinding heterogeneous materials thanks to the variable speed of 700 – 3,000 min-1, different rotors, sieves and collecting systems. An optional cyclone improves discharge of low density materials and creates an additional cooling effect. The sample does not get too warm during the process ensuring that properties are not altered. The mill is quickly and easily cleaned thanks to the fold-back hopper and push-fit rotor.
In a fine-grinding step the sample was milled twice in the Ultra Centrifugal Mill ZM 200 at 18,000 min-1, first using a 1 mm ring sieve, followed by a 0.25 mm ring sieve. After 2 min the sample size was reduced to 0.25 mm. Analysis of the elements carbon, sulphur and hydrogen in the 4 mm and the 0.25 mm sample (each sample was measured 4 times) was carried out with the Elemental Analyser CHS-580 from Eltra. Unlike the CS-580 used for analysing lignite, this analyser possesses an additional infrared cell for the determination of hydrogen.
The application example of compost shows that better homogenisation can have significant effects on the analysis of elements. It reduces the standard deviation by more than a factor 10.
Moreover, much higher contents of the elements were measured in the fully homogenised samples.
Conclusion
The examples described in this article illustrate impressively how sample division and sample homogenisation can strongly influence analytical results.
Standard deviation is decreased and more accurate results are achieved because the sample properties are equally distributed in the sample.
To avoid errors leading to false results, it is essential to handle the sampling, sample division and preparation with the same accuracy as the analysis itself.
Digital Edition
Chromatography Today - Buyers' Guide 2022
October 2023
In This Edition Modern & Practical Applications - Accelerating ADC Development with Mass Spectrometry - Implementing High-Resolution Ion Mobility into Peptide Mapping Workflows Chromatogr...
View all digital editions


Events
Apr 23 2024 Kintex, South Korea
Apr 23 2024 Seoul, South Korea
Apr 28 2024 Montreal, Quebec, Canada
May 05 2024 Seville, Spain
May 15 2024 Birmingham, UK