HPLC, UHPLC
A Simple, Generally Applicable HILIC Method Development Platform Based Upon Selectivity
Dec 02 2015
Author: Alan P McKeown on behalf of Advanced Chromatography Technologies
Hydrophilic interaction chromatography (HILIC) separations are gaining popularity across many industry sectors and application areas. Despite this, method development experience for many analysts is still low compared to reversed-phase liquid chromatography (RPLC). In this work, a broadly applicable HILIC method development screening platform is proposed. Depending upon the analytes to be screened, a maximum of three stationary phases and three eluent pH values are selected providing nine chromatograms for evaluation prior to next steps to achieve the method objective. An example HILIC method development activity for caffeine and related substances (as example polar neutral analytes) is shown.
Introduction
Hydrophilic interaction chromatography (HILIC) has been developing and evolving as a separation mode for retaining neutral and polar analytes poorly retained in reversed-phase liquid chromatography (RPLC) since the early 1990s. Described as a technique employing a polar stationary phase (e.g. unbonded silica) with reversed-phase type eluents (e.g. aqueous-organic mixtures) [1], HILIC is different practically and mechanistically from both normal and reversed-phase liquid chromatography. Others have investigated and explored the different stationary phase and eluent selectivity for this separation mode [2,3]. Detailed studies into HILIC separation mechanisms have been described elsewhere and are not the purpose of this discussion [4-10]. However, it is clear that mechanistically HILIC is complex and provides multiple modes of interaction: between the analyte, stationary phase, eluent and water enriched layer at the stationary phase particle-eluent interface [9,11].
HILIC is highly suited to the analysis of polar to very polar analytes; an area that RPLC has typically achieved limited success without the use of ion-pair reagents or additives (both of which bring their own challenges). For this discussion, polar to very polar analytes are defined as those compounds with a log P value (i.e. octanol – water partition coefficient) of approximately zero or less. A log P value is a reasonable rough guide to the lipophilicity of an analyte. A log P value of zero or less indicates the analyte is highly water soluble or has significant hydrophilic properties and so more suited to a HILIC separation mode. The more lipophilic an analyte, the more suited it is for RPLC. Log D data (partitioning of an analyte as a function of ionisation at a specific eluent pH) can also help. The lower or more negative a log D value, the more ionised and polar the analyte indicating its suitability for HILIC separations. Of course, when dealing with unknown analytes, such data is not available and should method development analysts have analyte solubility / sample diluent concerns there are recommendations and guidance available [12].
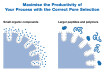
As a general rule of thumb, if an analyte elutes before caffeine in RPLC (log P ~zero), it may be better suited to a HILIC separation mode. Figure 1 shows a schematic continuum from HILIC to RPLC separation modes with illustrative log P values and analytes. The area of overlap between the separation modes around caffeine typically causes the most discussion. In this area either mode may offer advantages – the choice is usually application driven.
HILIC offers a number of attractive characteristics and complementary benefits to RPLC. Despite this (and whilst the awareness and popularity of HILIC separations from peer reviewed literature and symposia is more widespread and growing [13]), the practical success and method development knowledge of HILIC remains some way behind RPLC. As with RPLC, there are a variety of approaches to HILIC method development that include: applying prior knowledge of separation conditions from related analytes, peer-reviewed literature work, iterative experiments, systematic screening experiments or design of experiments protocols. All approaches have pros and cons. Unless prior knowledge and experience of a compound or class is known, many analysts will apply a broad general scouting approach at one set of conditions (e.g. low pH, one stationary phase) followed by iterative steps to attempt separation. This path is popular, as it does not rely on access to literature databases or commercial software to define experiments. It can however take time. It is possible to generate improved and more extensive separations knowledge of analytes in a mixture by using a systematic screening method development approach where the defined experiments are based upon known differences in selectivity.
In this brief discussion, a selectivity-based systematic screening platform focussed on stationary phase and eluent pH for HILIC method development is described. This simple platform will be used to develop a HILIC method for caffeine (as model active ingredient) and four related substances present at 0.5 %w/w.
Experimental Reagents and instrumentation
Chemicals, reagents, analytes, solvents and water were purchased from Sigma-Aldrich (Poole, UK) and Fisher Scientific (Loughborough, UK). Analyses used an Agilent 1100 LC quaternary instrument. The three stationary phases ACE HILIC-A1 (acidic character), ACE HILIC-N1 (neutral character) and ACE HILIC-B1 (basic character), 150 x 4.6 mm, 5 µm, are beta test columns from Advanced Chromatography Technologies Ltd (Aberdeen, UK).
Selectivity study
Columns were equilibrated for 100 column volumes using 10 mM ammonium formate at pH 3.0, 4.7 and 6.0, in MeCN/H2O (90:10 v/v) with a flow rate of 1.5 mL/min. A concentrated stock solution of ammonium formate at each pH was prepared and diluted accordingly to ensure a constant buffer concentration. Exploring broader pH ranges for HILIC is possible with appropriate phases but suitable selectivity and separation for a broad range of analytes has been found to be possible with eluent pH 3.0, 4.7 and 6.0. Temperature was 25°C with 230 and 254 nm detection. 48 pharmaceutically relevant compounds (0.5 mg/mL MeCN/H2O 90:10 v/v) representing small molecule analytes with a broad range of physico-chemical properties (acids (pKa range from -0.43 to 4.6 for p-toluene sulphonic acid and 4-hydroxybenzoic acid respectively), bases (pKa range from 5.7 to 10.5 for melamine and tyramine respectively), neutrals and zwitterionics) were injected onto each column. The HILIC-A1 and HILIC-B1 retention data have been used previously to calculate alternative selectivity data on prototype ACE HILIC phases using 54 analytes [14]. In this current work commercially representative phases and a new HILIC-N1 phase are used. New selectivity data are recalculated for all three ACE HILIC phase combinations and presented in a new format as selectivity diagrams. The recalculated selectivity values are used to define a new generally applicable HILIC method development platform not previously described.
Gradient screening for the caffeine method development example
Columns were equilibrated for 50 column volumes at the starting gradient conditions prior to use. Mobile phases were A = 10 mM ammonium formate, pH 3.0 or pH 4.7 in MeCN/H2O (94:6 v/v) and B = 10 mM ammonium formate, pH 3.0 or pH 4.7 in MeCN/H2O (50:50 v/v). The gradient was 0-100 %B in 15 minutes at 1.5 mL/min. A constant total 10mM buffer concentration was kept across the gradient ranges to ensure no additional selectivity effects from varying buffer concentrations would be seen. Temperature = 25°C with detection at 275 nm. 2 µL injections of a 25 mg/mL caffeine mixture (with the related substances at 0.5 %w/w) in MeCN/H2O (90:10 v/v).
Results and Discussion
Comparing the selectivity differences between the three HILIC stationary phases at each pH
The retention times were plotted on each stationary phase against each other for all 48 analytes to examine the degree of scatter i.e. selectivity differences. As an example, the retention time graph for HILIC-A1 versus HILIC-N1 at pH 4.7 gave a correlation coefficient (r2) of 0.4476 (data not shown) indicating good scatter. It is clear there is a high degree of difference between these two phases under these conditions. This is to be expected due to the acidic and neutral nature of the phases respectively and the mixed properties of the analytes. With charged surfaces, acidic and basic phases will be dominated by electrostatic interactions with cationic and anionic analytes respectively. Neutral phases will have a high degree of hydrogen bonding with analytes as a principle mode of interaction. Nevertheless, a variety of ion-exchange, partitioning into the water enriched layer on the particles and other mechanisms affect the differences in retention and separation. Inserting the correlation coefficient into Equation 1 yields the selectivity descriptor value [15] which is determined as S = 74.
Download the PDF for the full story>>
Digital Edition
Chromatography Today - Buyers' Guide 2022
October 2023
In This Edition Modern & Practical Applications - Accelerating ADC Development with Mass Spectrometry - Implementing High-Resolution Ion Mobility into Peptide Mapping Workflows Chromatogr...
View all digital editions


Events
Apr 28 2024 Montreal, Quebec, Canada
May 05 2024 Seville, Spain
May 15 2024 Birmingham, UK
May 19 2024 Brno, Czech Republic
May 21 2024 Lagos, Nigeria